

Inventory Overview
Your single source of truth for stock levels, sales velocity, forecasted demand, and replenishment recommendations across every Amazon marketplace.
The Inventory Overview is the heart of Profit Hawk. It pulls every product, every marketplace, every warehouse, and every reorder recommendation into a single table so you can answer the questions that drive your business: what is running out, what needs to be ordered, what needs to move from your warehouse to FBA, and what is selling.
You will spend most of your time in Profit Hawk on this page. This guide explains how it is laid out and what you can do here.
Where to find it
In the left navigation, click Inventory Overview. The URL is /app/<your-org>/inventory-overview.
How the page is laid out
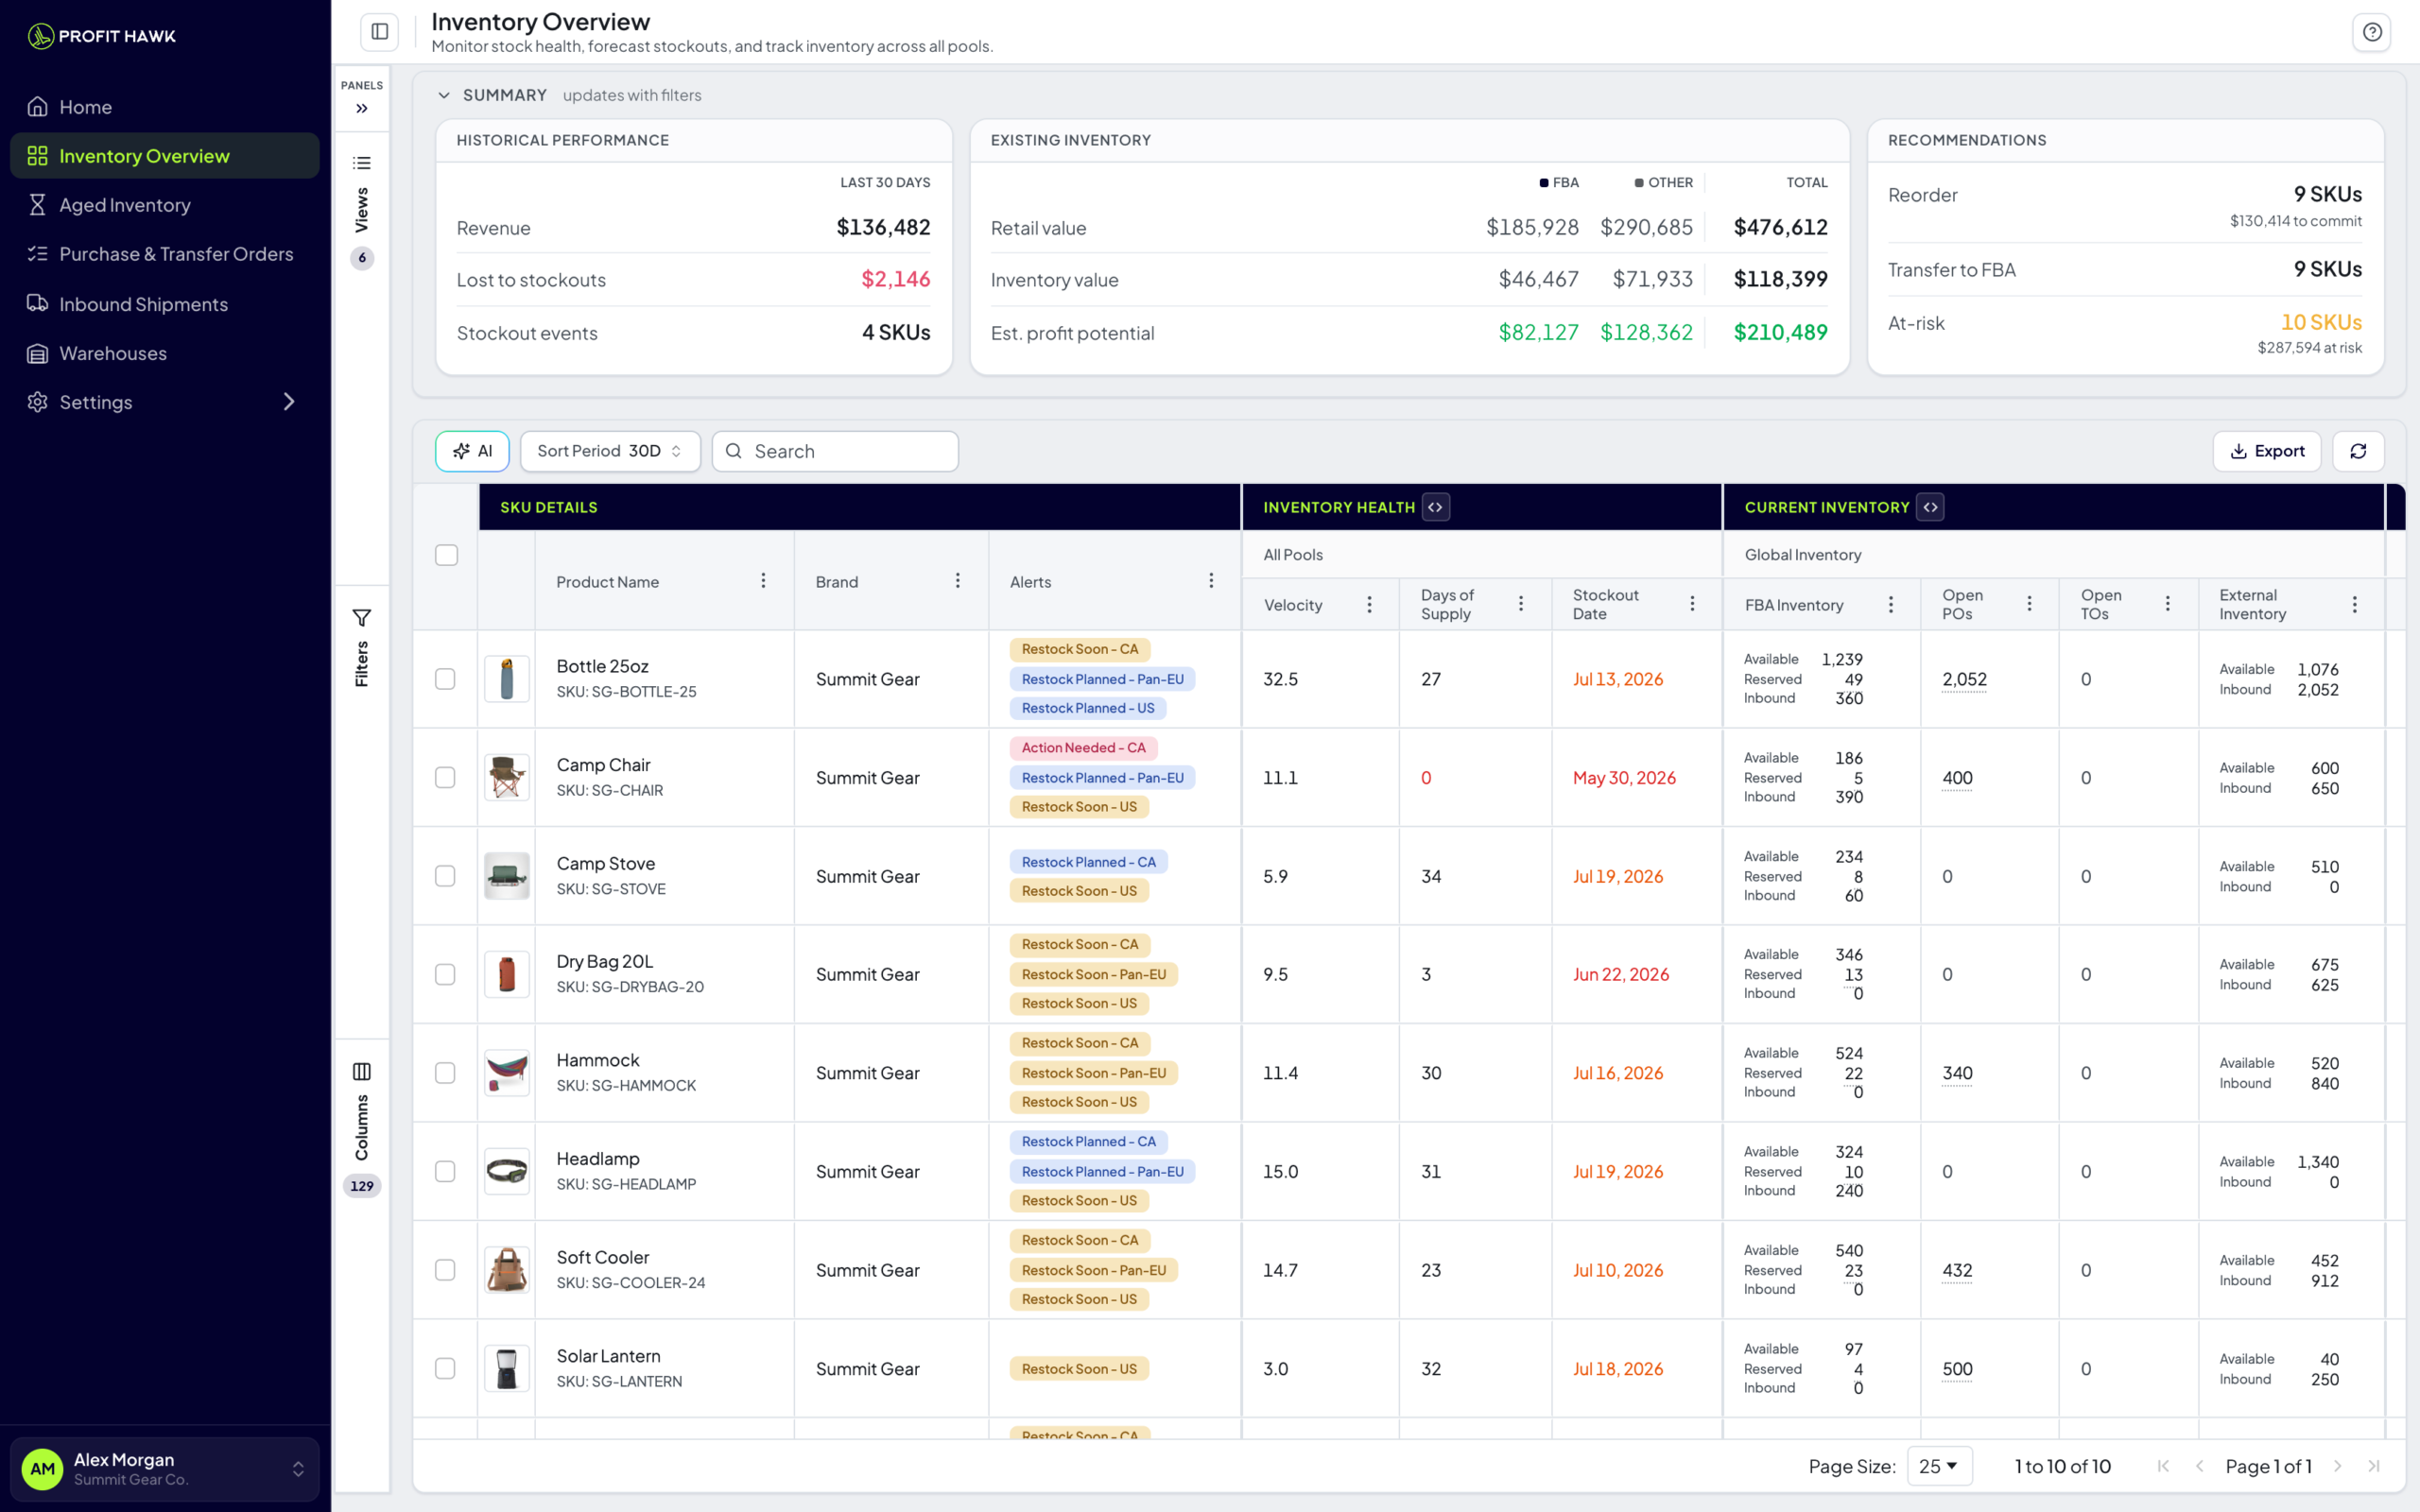
The Inventory Overview has a collapsible panel on the left and the main table area on the right:
- Views, Filters & Columns panel -- a left-hand panel (it collapses to a slim icon rail) where you switch views, build filters, and choose which columns to show
- Summary -- a collapsible band that summarizes performance, inventory value, and recommendations, and updates as you filter
- Toolbar -- AI search, Group by, search, export, and Refresh Forecasts
- Inventory table -- one row per product, with grouped columns for health, inventory, sales, ads, and reorder recommendations
Summary
A collapsible Summary band sits above the table and recalculates as you filter, so it always reflects the products you are currently looking at. It has three cards:
| Card | What it shows |
|---|---|
| Historical Performance | Last 30 days of revenue, revenue lost to stockouts, and how many SKUs had a stockout event |
| Existing Inventory | Retail value, inventory value at cost, and estimated profit potential of the stock you hold, split across FBA, Other, and Total |
| Recommendations | How many SKUs need a reorder (and the cash to commit), how many need a transfer to FBA, and how many are at risk (with the revenue at risk) |
Collapse the band with the chevron next to Summary when you want more room for the table.
Views, Filters & Columns panel
A panel on the left side of the table holds three sections. Click a section to open it, and collapse the whole panel to a slim icon rail when you want the table at full width.
- Views -- switch between the built-in views and your own saved views in one click
- Filters -- build precise filters on any column and see what is currently applied
- Columns -- show, hide, and reorder column groups
The Views section starts with up to five built-in views, each with a count so you can see how many products fall into each bucket at a glance (Transfer Needed only appears when you have a 3PL or AWD to transfer from):
- All Products -- every active product
- Restock Needed -- products with a recommended supplier order quantity greater than zero
- Transfer Needed -- products with a recommended transfer quantity greater than zero
- Out of Stock -- products with zero FBA inventory
- In Stock -- products with FBA inventory greater than zero
Below the built-in views you can save your current filters, sort order, and visible columns as your own named view, then switch back to it in one click. Saved views are shared with your team.
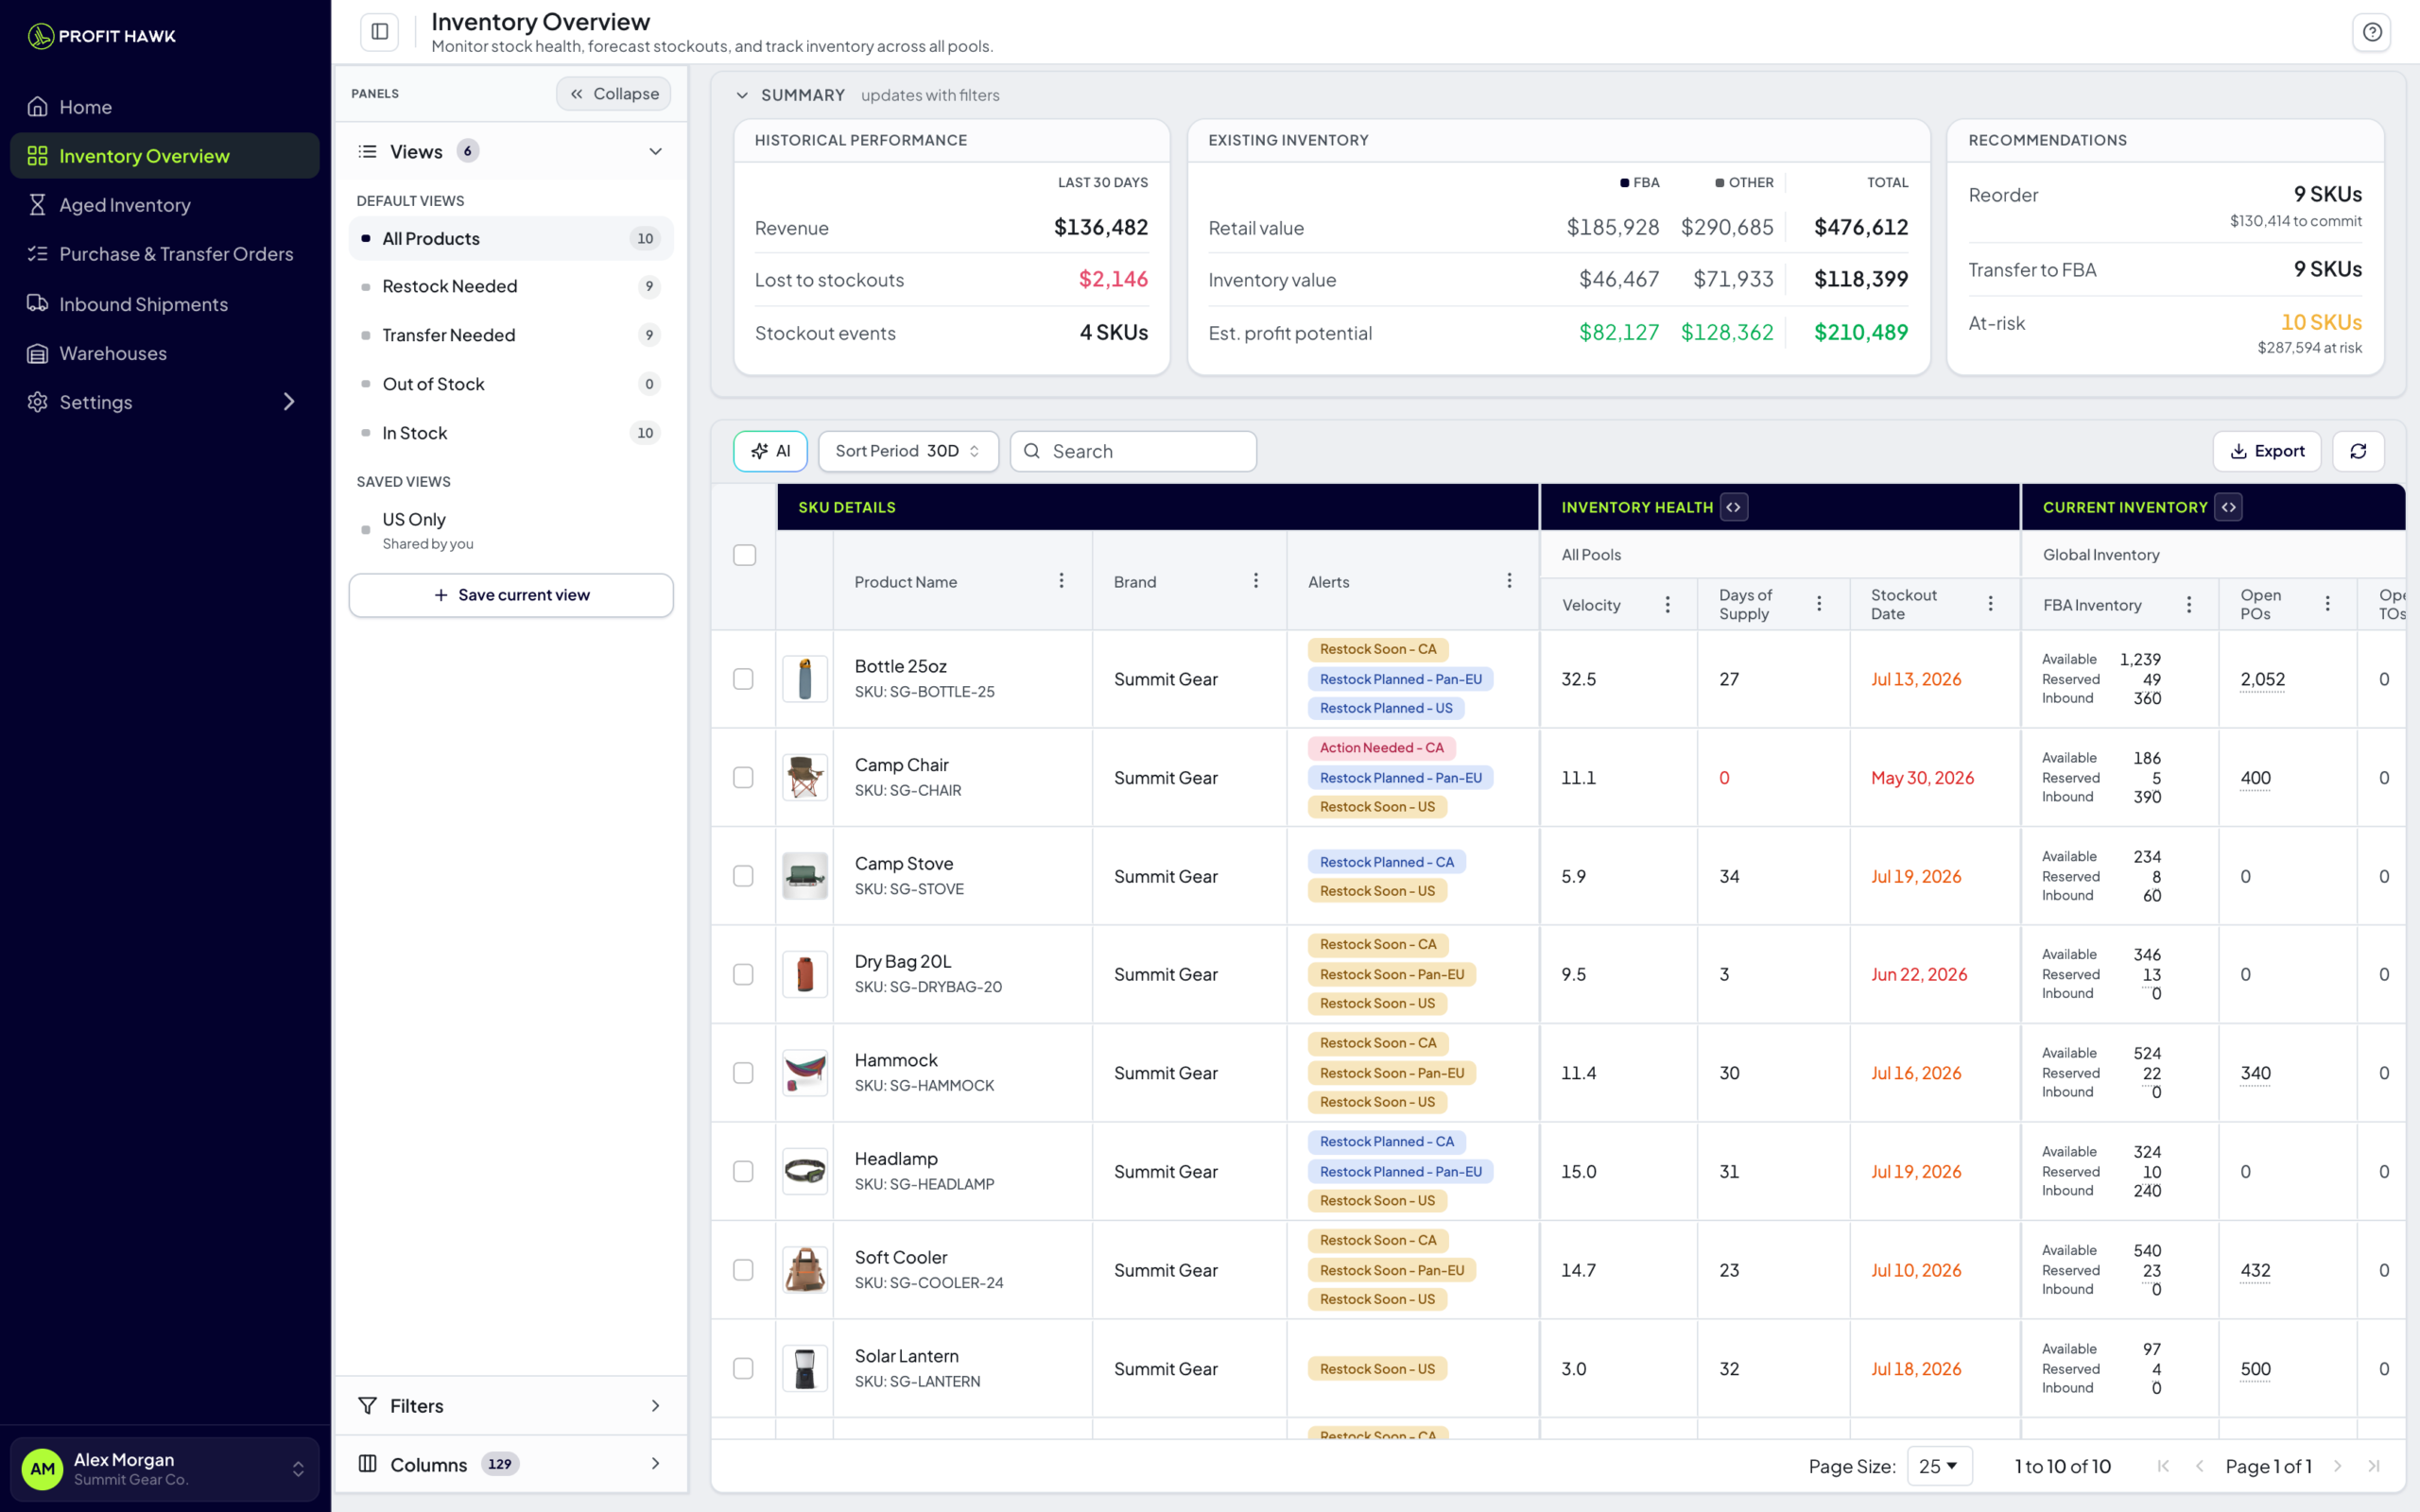
The Transfer Needed view only appears when your account has somewhere to transfer from (a 3PL warehouse or AWD). If all of your stock lives in FBA, there is nothing to transfer, so the view and the Suggested Transfer Orders columns stay out of your way.
Learn more: Saved Views
Select or clear a whole column group
In the Columns section, hover a group and a Select all action appears at the right edge of its row. Click it to show every column in that group at once instead of ticking each checkbox one at a time. When all of them are already showing, the action reads Clear all and hides them.
This works at both levels. Hover a pool group such as All Pools or UK to take just that pool's columns, or hover a section header such as Inventory Health to take every column in the section, across all of its pools.
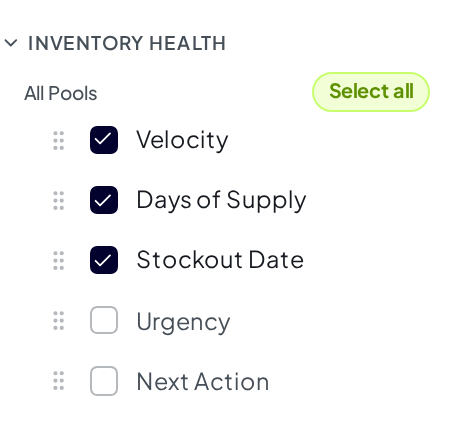
A section can hold dozens of columns, so a bulk change shows a toast with an Undo button. Undo puts back exactly the columns that changed and leaves your other choices alone.
Columns that are always shown, such as the product image and name, are not affected. If a search is active, the action applies to the columns matching your search.
Toolbar
| Tool | What it does |
|---|---|
| AI search | Type plain English ("show me products running low," "items with no sales in 30 days") and Profit Hawk builds the right filters automatically |
| Group by | Group the table into Replenishment Priority tier bands or show a flat list. See Group products by Replenishment Priority |
| Search | Quick text search by product name or SKU |
| Export | Download the current view as an Excel file |
| Refresh Forecasts | Trigger a recompute. New numbers are ready in 10 to 15 minutes |
To build a precise filter on a specific column, use the Filters section of the left panel.
Learn more: Filtering & Searching
Inventory table
Each row is one of your inventory products. Columns are organized into groups, and you can show or hide whole groups from the Columns section of the left panel:
- SKU Details -- product image, name, SKU, ASIN, brand, and per-pool alert badges like "Action Needed" and "Restock Soon." This group is pinned to the left, so it stays in view as you scroll the table sideways. See Copy a SKU or ASIN below.
- Inventory Health -- velocity, days of supply, projected stockout date, urgency, next action
- Current Inventory -- FBA Available, FBA Reserved, FBA Inbound, external warehouse and AWD quantities, the total units on open purchase orders (Open POs) and open transfer orders (Open TOs), and a Low-Inventory Fee column showing each product's exemption status for Amazon's low-inventory-level fee
- Suggested Supplier Reorders -- recommended order quantity, order-by date, estimated cost, estimated profit, urgency. Expand the group header to break the totals down by inventory pool (for example UK FBA (MENA), EU (Pan-EU), or a single marketplace), the same way Inventory Health does.
- Suggested Transfer Orders -- recommended transfer quantity, transfer-by date, urgency. This group only appears when you have a 3PL warehouse or AWD to transfer from.
- Sales -- Amazon units and revenue, with 7D, 30D, 90D, and 1Y stacked in each cell
- Traffic -- page views and sessions, stacked the same way
- Amazon Ads -- ad spend, ad units, and ad revenue (stacked the same way), plus estimated profit
The Sales, Traffic, and Amazon Ads cells each stack four date ranges, so you can compare them at a glance. To rank your products by one of those ranges, see Sort by date range.
Hover the Est. Profit value in the Suggested Supplier Reorders group to see the per-marketplace profit math. Marketplaces that share one inventory pool (like AE and UK under a MENA remote fulfillment setup, or NARF in North America) are grouped under a single pool header, so you can see at a glance which marketplaces draw from the same stock.
Click any row to open the product details drawer where you can adjust settings, view full forecasts, and see per-pool inventory breakdowns. Hold Ctrl (or Cmd on Mac) and click to open the full product page in a new tab.
Copy a SKU or ASIN
Beneath each product's name, the SKU Details column shows the product's SKU and ASIN. Hover either one and a copy icon appears. Click it to copy that value to your clipboard, and the icon briefly turns to a checkmark to confirm. This lets you grab a SKU or ASIN to paste into Seller Central, a supplier email, or a spreadsheet without leaving the table.

Learn more: Inventory Health & Alerts
Group products by Replenishment Priority
By default, the Inventory Overview is grouped into Replenishment Priority tiers. Each tier is a colored band across the table, with your highest-priority products at the top, and every band rolls up its own totals so you can see where your inventory and your risk are concentrated without scrolling through every row.
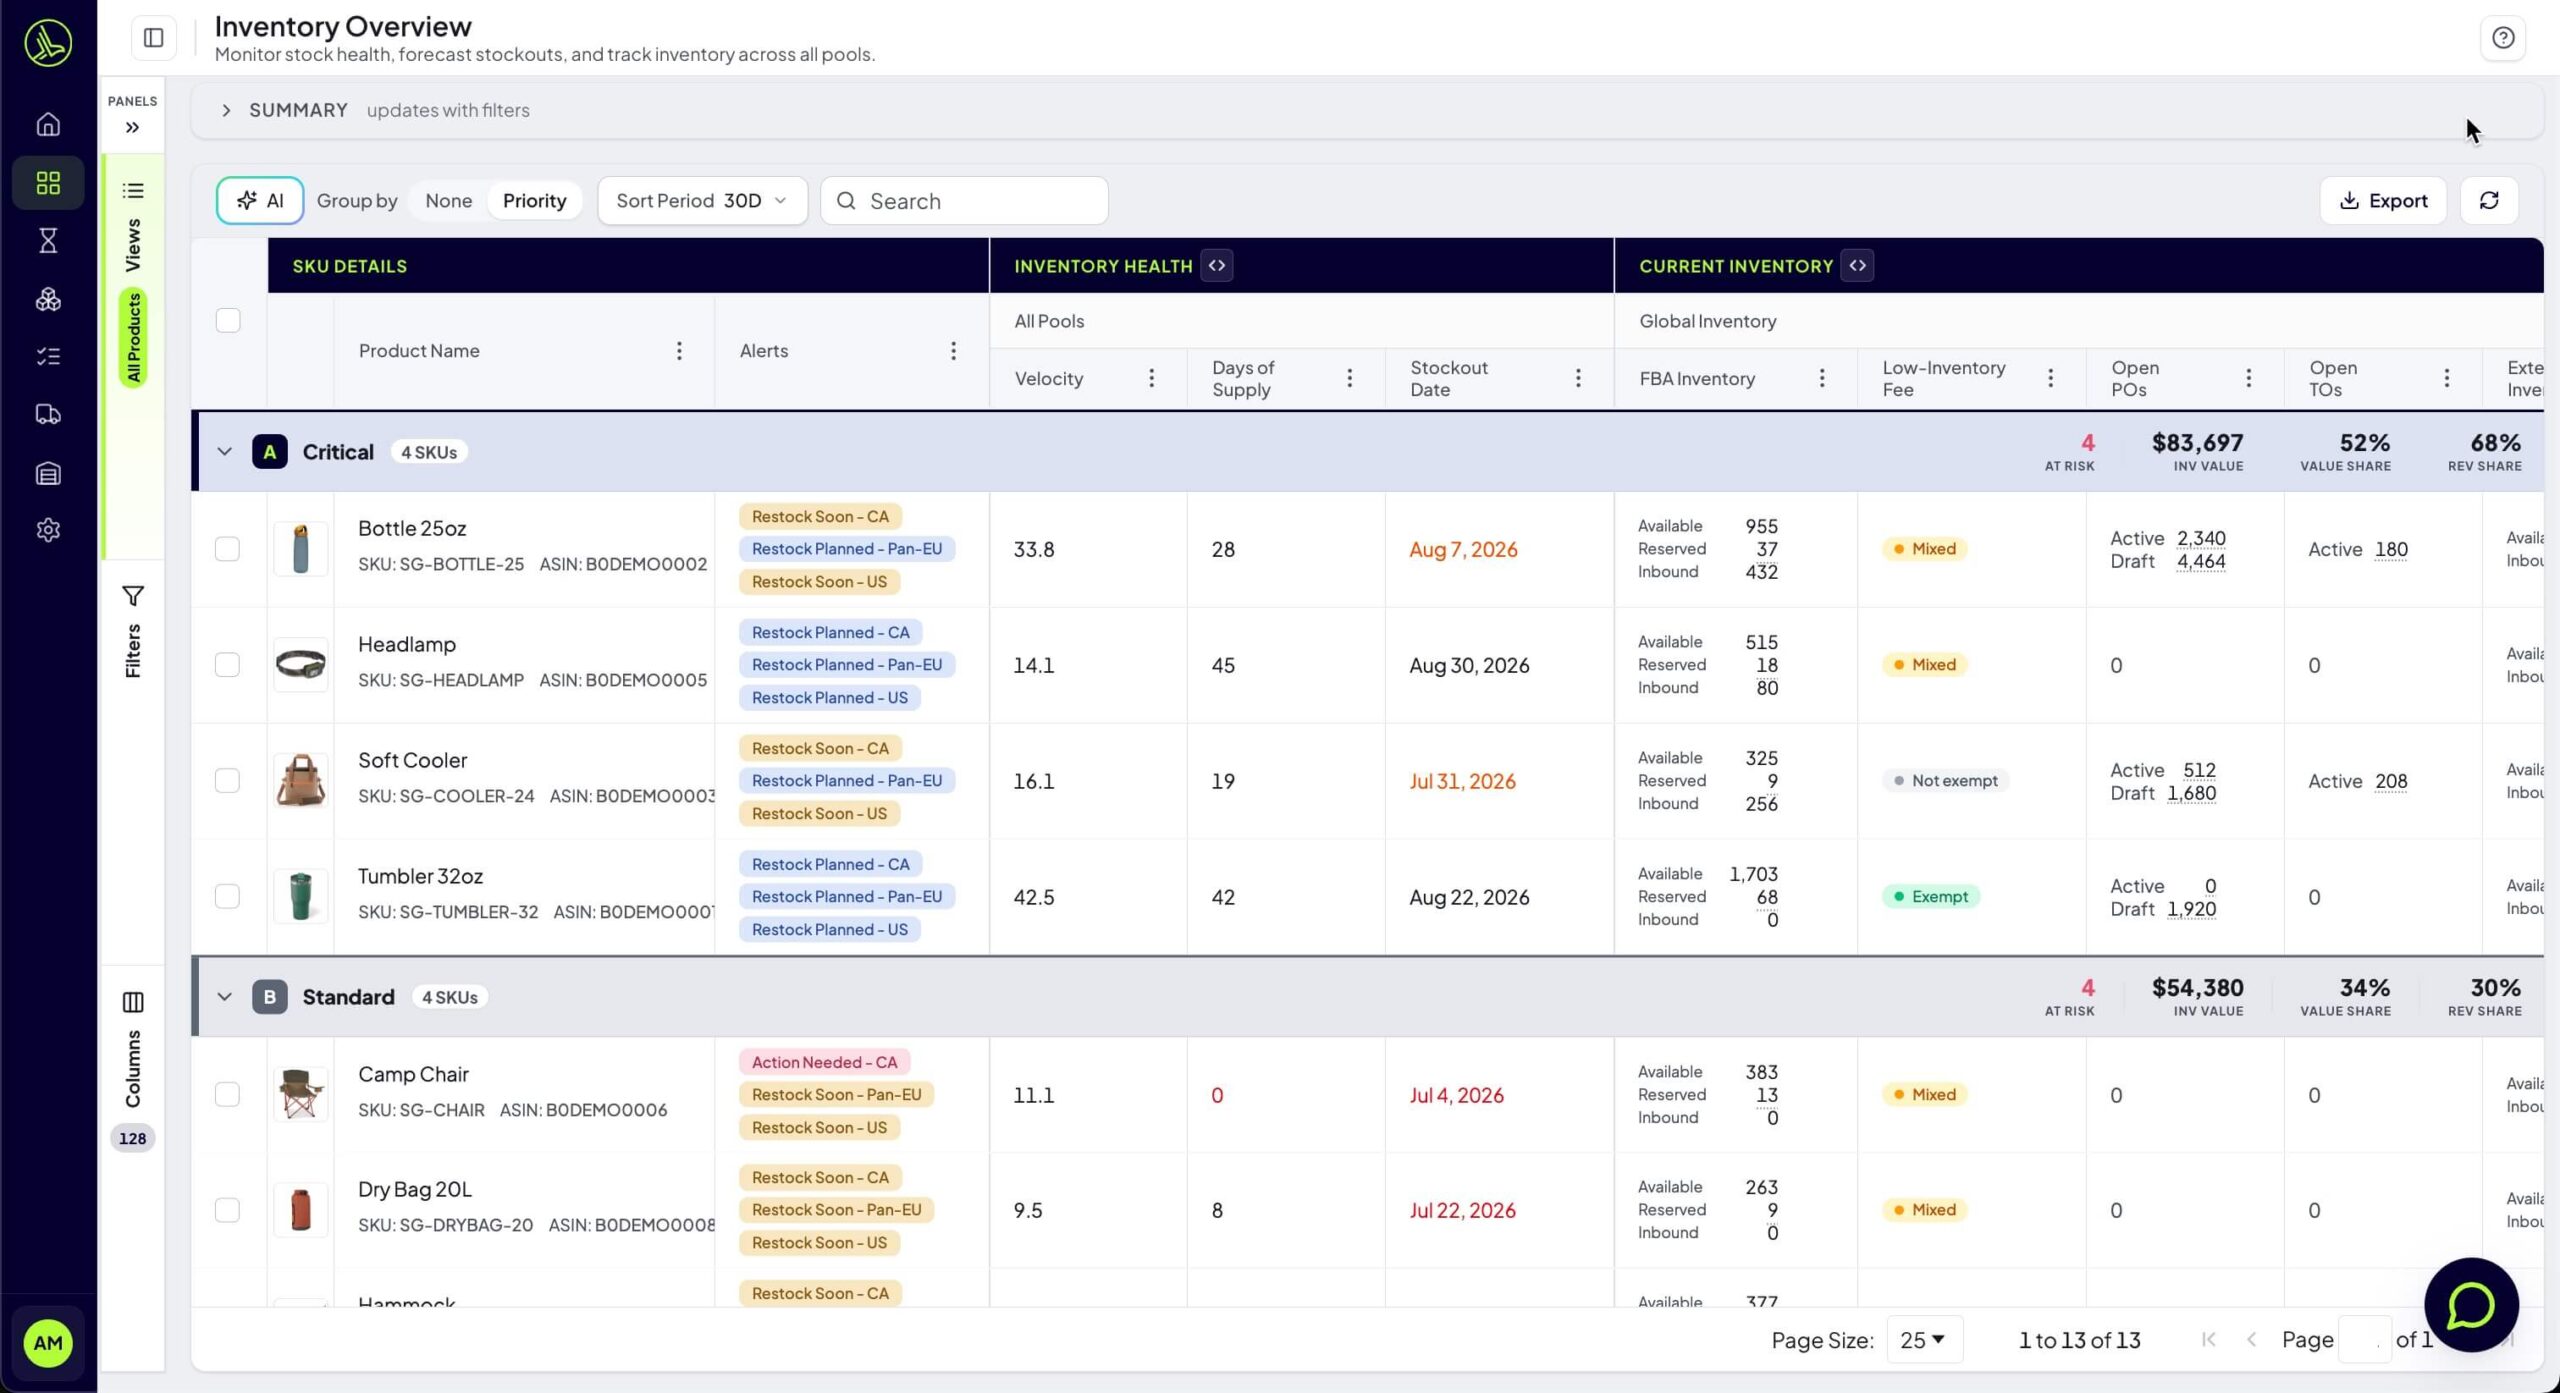
What Replenishment Priority means
Replenishment Priority is how important a product is to keep in stock. It is a stocking-strategy classification, and it sets the safety-stock service level Profit Hawk targets for that product:
| Priority | Service level | Best for |
|---|---|---|
| A - Critical | ~95% | Top sellers and high-impact products you almost never want to stock out |
| B - Standard | ~90% | Mid-tier products. The default for most of your catalog |
| C - Long-tail | ~85% | Slow movers and low-margin products, where a leaner buffer is fine |
Products that do not have a priority set yet collect into an Unassigned band.
Replenishment Priority is not the same as Urgency. Priority is a long-term stocking strategy (how big a safety-stock buffer to hold). Urgency (Critical, Soon, Planned, OK, Not Needed) is the short-term signal that a specific product needs a reorder now. A product can be A - Critical priority and still be OK on urgency when it is well stocked, so an "A - Critical" tier does not mean "reorder this right now." For how the priority tiers change the buffer math, see Safety Stock.
Turn grouping on or off
Use the Group by control in the toolbar, next to the AI search box, to switch between:
- Priority -- group the table into Replenishment Priority tier bands. This is the default.
- None -- show a flat, ungrouped table.
Use the chevron on a tier band to collapse or expand the products inside it.
What each tier band shows
Every band summarizes the products inside it, so you can compare tiers at a glance without expanding them:
| Stat | What it shows |
|---|---|
| SKUs | How many products are in this tier, after any filters you have applied |
| At risk | How many products in this tier have revenue at risk from a forecasted stockout |
| Inv value | The inventory value at cost held in this tier |
| Value share | This tier's share of your total inventory value |
| Rev share | This tier's share of your revenue over the last 30 days |
The bands and their totals recalculate as you filter, so they always reflect the products you are currently looking at.
To set or change a product's priority, use the Replenishment Tier field in Product Settings. To see each product's tier inline, add the Priority column (it reads A - Critical, B - Standard, or C - Long-tail) from the Columns section of the left panel.
Sort by date range
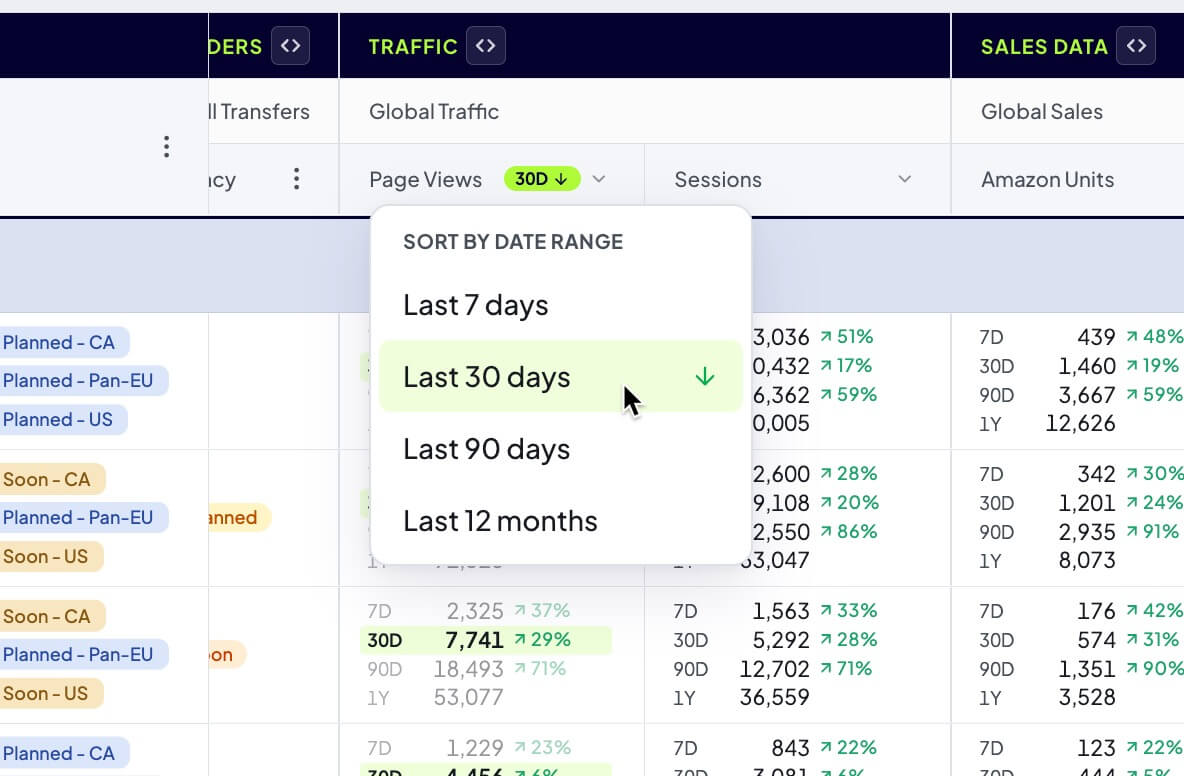
The Traffic, Sales, and Amazon Ads columns each stack four date ranges (7D, 30D, 90D, and 1Y) in a single cell, so you can see all of them at once. Because one column holds four numbers, you choose which range to rank by right in the column header.
Click a metric header
Click the header of a stacked metric, such as Amazon Revenue, Amazon Units, Page Views, Sessions, or any Amazon Ads metric. A small popover opens listing the four ranges.
Pick the date range to sort by
Choose Last 7 days, Last 30 days, Last 90 days, or Last 12 months. The table sorts by that metric over that range, highest first.
Read the badge and the highlight
The sorted column shows a lime badge with the active range and its direction (for example, 30D with a down arrow for highest first). In every cell of that column, the range you sorted by is highlighted and the other three are dimmed, so the basis for the order is always clear.
To switch between highest first and lowest first, click the same range again. To rank by a different metric, click that metric's header and pick a range. The badge and highlight move to the new column so only one metric drives the order at a time.
This replaces the old Sort Period dropdown. Because you now pick the range on the exact column you want to rank by, and that column shows which range it is using, the sort is never a mystery.
Acting on the data
When you see something that needs action, you have two paths:
- Single product -- click the row to open the product drawer and review or adjust the recommendation
- Bulk action -- check multiple rows, then use the toolbar that appears at the bottom to Create Order or Add to Order
Profit Hawk groups products into restock plans (purchase orders for suppliers, transfer orders for warehouses). You can build a plan from any selection of products on this page.
Learn more: Bulk Actions & Restock Plans
Common workflows
The Inventory Overview is built around a handful of recurring jobs. We have a guide for each one:
Identify Reorders
Find every product that needs a new supplier order, set quantities, and create the purchase order.
Identify Transfers Needed
Find products that need stock moved from a warehouse or AWD into FBA before they sell out.
View Excess Inventory
Spot products that are overstocked relative to demand so you can slow reorders or run promotions.
Find Shipments Requiring Reimbursement
Identify inbound shipments where Amazon never received everything you sent.
Refreshing forecasts
The forecasts and replenishment numbers in the table are recomputed in the background on a schedule. If you have just changed product settings (lead time, MOQ, days of stock) and want the new numbers immediately, click the Refresh Forecasts button on the toolbar. The recompute runs in the background and the new values typically appear within 10 to 15 minutes.
Sub-pages in this section
Saved Views
Switch between the built-in views and your own saved views, and learn what each one filters for.
Filtering & Searching
Build precise filters by column, value, marketplace, warehouse, and timeframe. Use AI search for plain-English queries.
Inventory Health & Alerts
Understand days of supply, urgency levels, alert badges, and how Profit Hawk decides what is at risk.
Bulk Actions & Restock Plans
Select multiple products and turn them into purchase orders or transfer plans in two clicks.
Low-Inventory Fee
See which products are exempt from Amazon's low-inventory-level fee, per marketplace.