

Product Costs
Track landed costs per unit for each product in Profit Hawk to enable profitability calculations and supplier order cost estimates.
Product costs let you record what each unit actually costs you, broken down by cost category. Profit Hawk uses these costs to estimate the total cost of supplier order recommendations and to calculate product-level profitability.
Each product can have multiple cost entries with different effective dates, so you can track cost changes over time (new supplier quotes, shipping rate changes, tariff adjustments, etc.).
Accessing product costs
Open any product from the Inventory > Products tab. Scroll down to the Product Costs section. This shows a table of all cost entries for the product, sorted by effective date.
Cost categories
Each cost entry is broken into six categories. Together they represent the full landed cost per unit:
| Category | What to include |
|---|---|
| Manufacturing Cost | The per-unit price your supplier charges to produce the product |
| Shipping Cost | Freight costs per unit (ocean, air, or a blend) |
| Prep Cost | Labeling, poly-bagging, bundling, or other prep services per unit |
| Import Cost | Customs duties, tariffs, and import fees per unit |
| Third-Party Logistics | Per-unit fees from your 3PL for receiving, storage, or handling |
| Other Costs | Any per-unit costs that don't fit the categories above (inspection fees, insurance, etc.) |
The Total Cost column is calculated automatically as the sum of all six categories.
Adding a cost entry
Click Add New
In the Product Costs table, click Add New. A new editable row appears at the top of the table.
Set the effective date
Enter the date this cost becomes active. Profit Hawk uses the most recent cost entry (by effective date) when estimating order costs.
Enter your costs
Fill in each cost category with the per-unit amount. Leave categories at zero if they don't apply.
Save
Click the save button to confirm the entry. The total cost is calculated and displayed automatically.
You don't need exact numbers for every category. Estimates are better than nothing. A rough landed cost lets Profit Hawk show you the estimated total cost on supplier order recommendations, which helps you compare ordering options and plan cash flow.
Editing and deleting cost entries
Click the edit icon on any cost row to make it editable. Change the values and save. To remove a cost entry, click the delete icon.
Deleting a cost entry is permanent. If you want to record that costs changed, add a new entry with the updated date and values instead of deleting the old one. This preserves your cost history.
How effective dates work
When a product has multiple cost entries, Profit Hawk uses the entry with the most recent effective date that is on or before the current date. This means you can add a future cost entry (for example, when you know a price increase is coming) and Profit Hawk will automatically start using it on that date.
Importing and exporting costs in bulk
For managing costs across many products at once:
Export your current costs
Go to Inventory > Products, open the Actions dropdown, and click Export Costs. You get an XLSX file containing every cost entry across all products.
Edit the spreadsheet
Add, update, or adjust cost rows. Each row is one cost entry for one product, and a single product can have several rows with different dates.
The spreadsheet calls this column Start Date. It is the same field the Product Costs table on the product calls Effective Date.
Choose an import mode
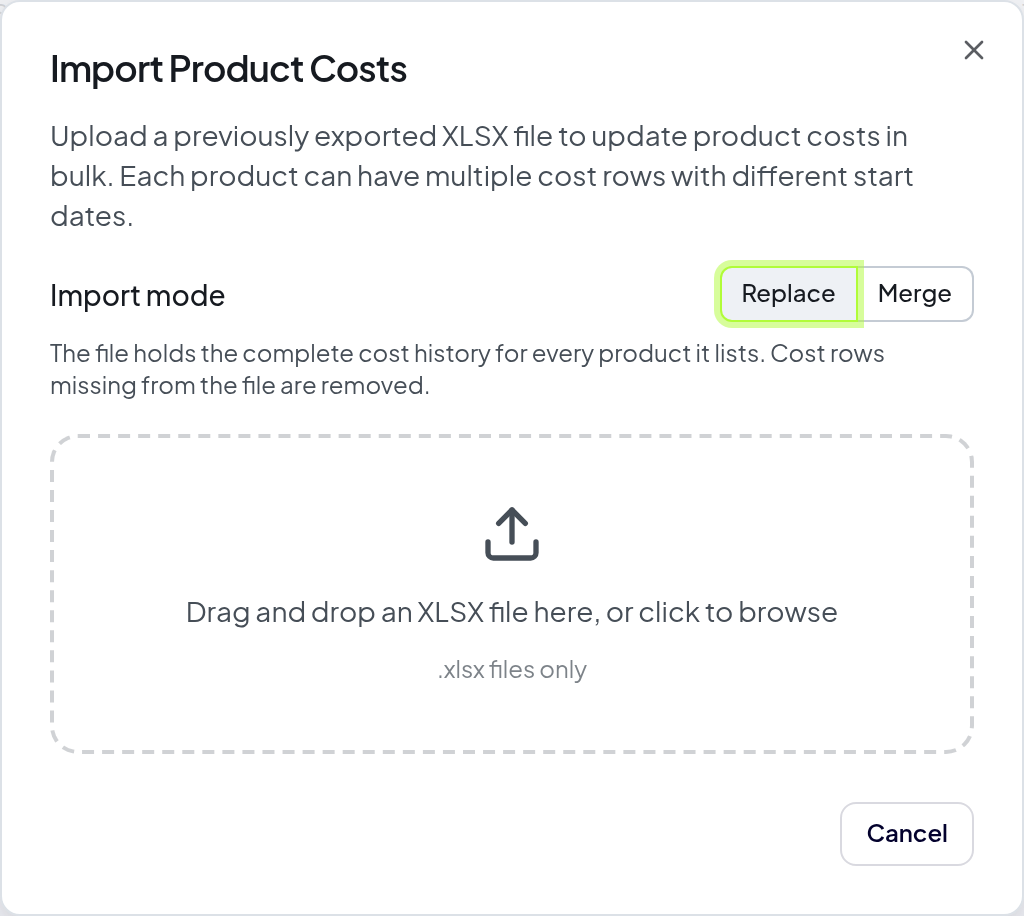
Click Import Costs, then pick Replace or Merge before you upload the file. The next section explains what each mode does.
Review the preview
Profit Hawk shows how many products it will update, how many are unchanged, and any rows it cannot accept, with the row number so you can find them in your file. Nothing is saved until you confirm.
Choosing between Replace and Merge
The import mode decides what happens to cost rows that already exist on a product but are missing from your file.
| Mode | What it does |
|---|---|
| Replace | Your file is the complete cost history for every product it lists. Any cost row missing from the file is removed. |
| Merge | Your file updates only the rows it lists. A row whose Start Date already exists is overwritten, a row on a new Start Date is added, and every other row stays as it is. |
Replace is the default. Use it when you exported the full file, edited it, and are uploading the whole thing back.
Use Merge for partial files. If you want to add a new cost date to 200 products, upload a file containing just those 200 rows and leave the rest of each product's cost history alone. This saves you from exporting and re-uploading your entire catalog to change a handful of costs.
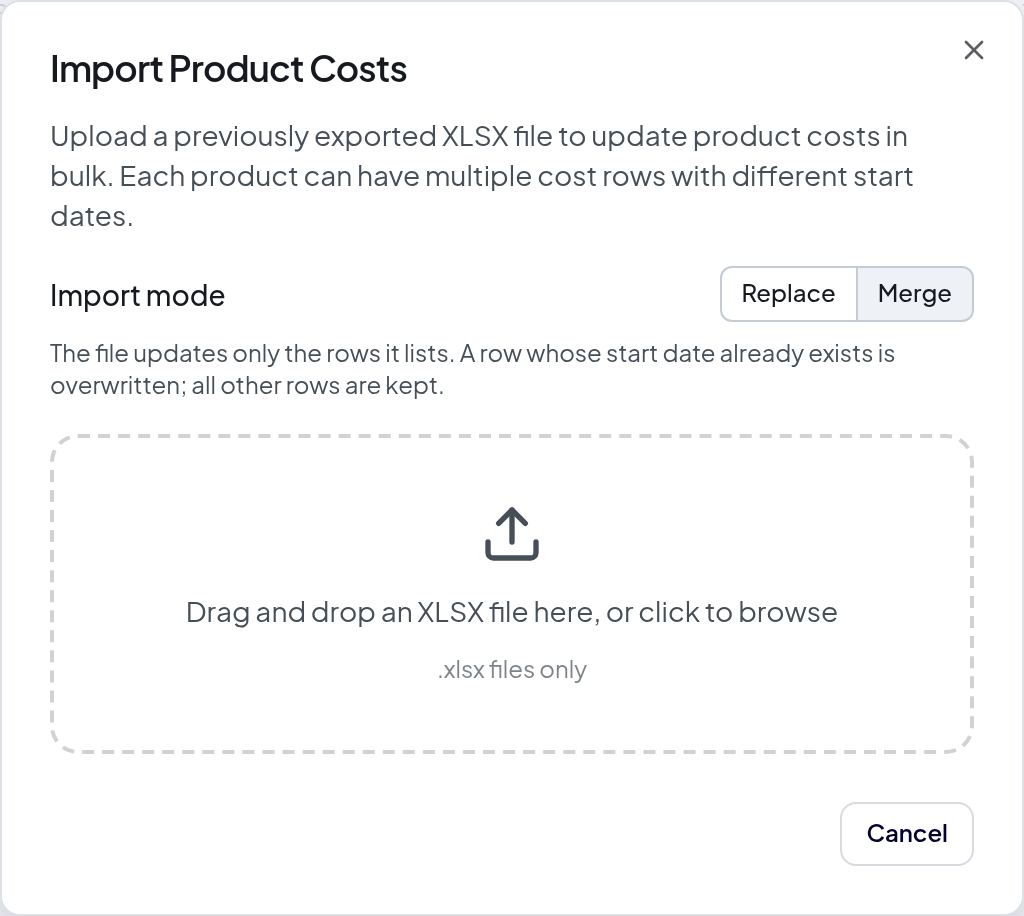
The text under the toggle always describes the mode you have selected, so you can confirm which one is active before you upload.
Products that do not appear in your file are never touched, whichever mode you pick.
In Merge mode, deleting a row from your spreadsheet does not delete the cost entry. Merge only applies the rows it can see, so a row you removed from the file stays on the product. To remove a cost entry, use Replace mode or delete the row directly from the Product Costs table.
You can switch between Replace and Merge after uploading. The preview recalculates straight away, so you can compare what each mode would do to your data before you confirm.
Currency in the spreadsheet
The Currency column accepts any currency Profit Hawk supports, and each cost row converts independently. A product can hold costs in more than one currency across its history, which is useful when you switch suppliers or change where you buy from. If you type a code Profit Hawk does not recognize, the preview flags that row instead of importing it.
Where costs are used
- Supplier order recommendations: The product detail page shows estimated total cost for each supplier order recommendation, calculated as unit cost multiplied by the recommended order quantity.
- Profitability: Cost data feeds into profitability metrics alongside revenue from your Amazon sales.
- Total Inventory Value by Product chart: The dashboard pie chart that shows how much cash is currently tied up in each product uses the manufacturing cost from the cost entry with the most recent effective date that is on or before the current date. See Total Inventory Value by Product.
Next steps
- Product Settings: Configure MOQ, days of stock, velocity profiles, and lead times
- Products: Overview of the Products page and how to manage your product catalog
- Creating Purchase Orders: Build purchase orders using cost data and replenishment recommendations
- Total Inventory Value by Product: See where your inventory cash is currently tied up