

How Forecasting Works
How Profit Hawk uses your sales history, lead times, and seasonality signals to forecast demand and recommend reorder quantities.
Profit Hawk's forecasting engine drives every replenishment recommendation, urgency badge, and stockout date you see in the app. This page explains, in plain terms, how it works so you can trust the numbers and tune the inputs that matter.
The short version
For every product in every marketplace pool, Profit Hawk does this:
- Calculates daily sales velocity from your historical Amazon orders, weighted by recency
- Adjusts for seasonality if you have set a primary keyword on the product
- Forecasts daily demand out 90 days into the future
- Calculates safety stock to buffer against demand and lead-time variability
- Recommends reorders and transfers by working backward from projected stockout dates and your days-of-stock targets
Each of those steps uses settings on the product. Get the settings right and the forecasts get sharp.
Sales velocity
Velocity is your average daily sales rate, measured in units per day. Profit Hawk pulls 18 months of order history from Amazon when you connect your account, then keeps it current with daily syncs.
Velocity is calculated for each timeframe: 7 days, 14 days, 30 days, 60 days, 180 days, and 365 days. The final velocity is a weighted average of those timeframes.
The weights depend on the velocity profile you set on the product:
| Profile | Behavior | Best for |
|---|---|---|
| Responsive | Reacts quickly to recent trend changes | Seasonal or fast-moving products where recent sales matter most |
| Balanced | Blends recent trends with long-term baseline | A good default for most products |
| Stable | Emphasizes long-term averages over short-term noise | Steady-demand products where you do not want a single slow week to change the forecast |
| Custom | Set your own weights for each timeframe | Advanced users who want full control |
The Sales Velocity table on the product detail page shows the calculated velocity for each timeframe along with the weight applied to each.
If a product does not have enough sales history for a given timeframe (for example, a 365-day window for a brand-new product), that timeframe is automatically excluded and does not skew the result.
Why the headline velocity differs from what you sold
Your sold rate and your adjusted velocity are usually different numbers, and the Sales Velocity panel shows you every step between them.
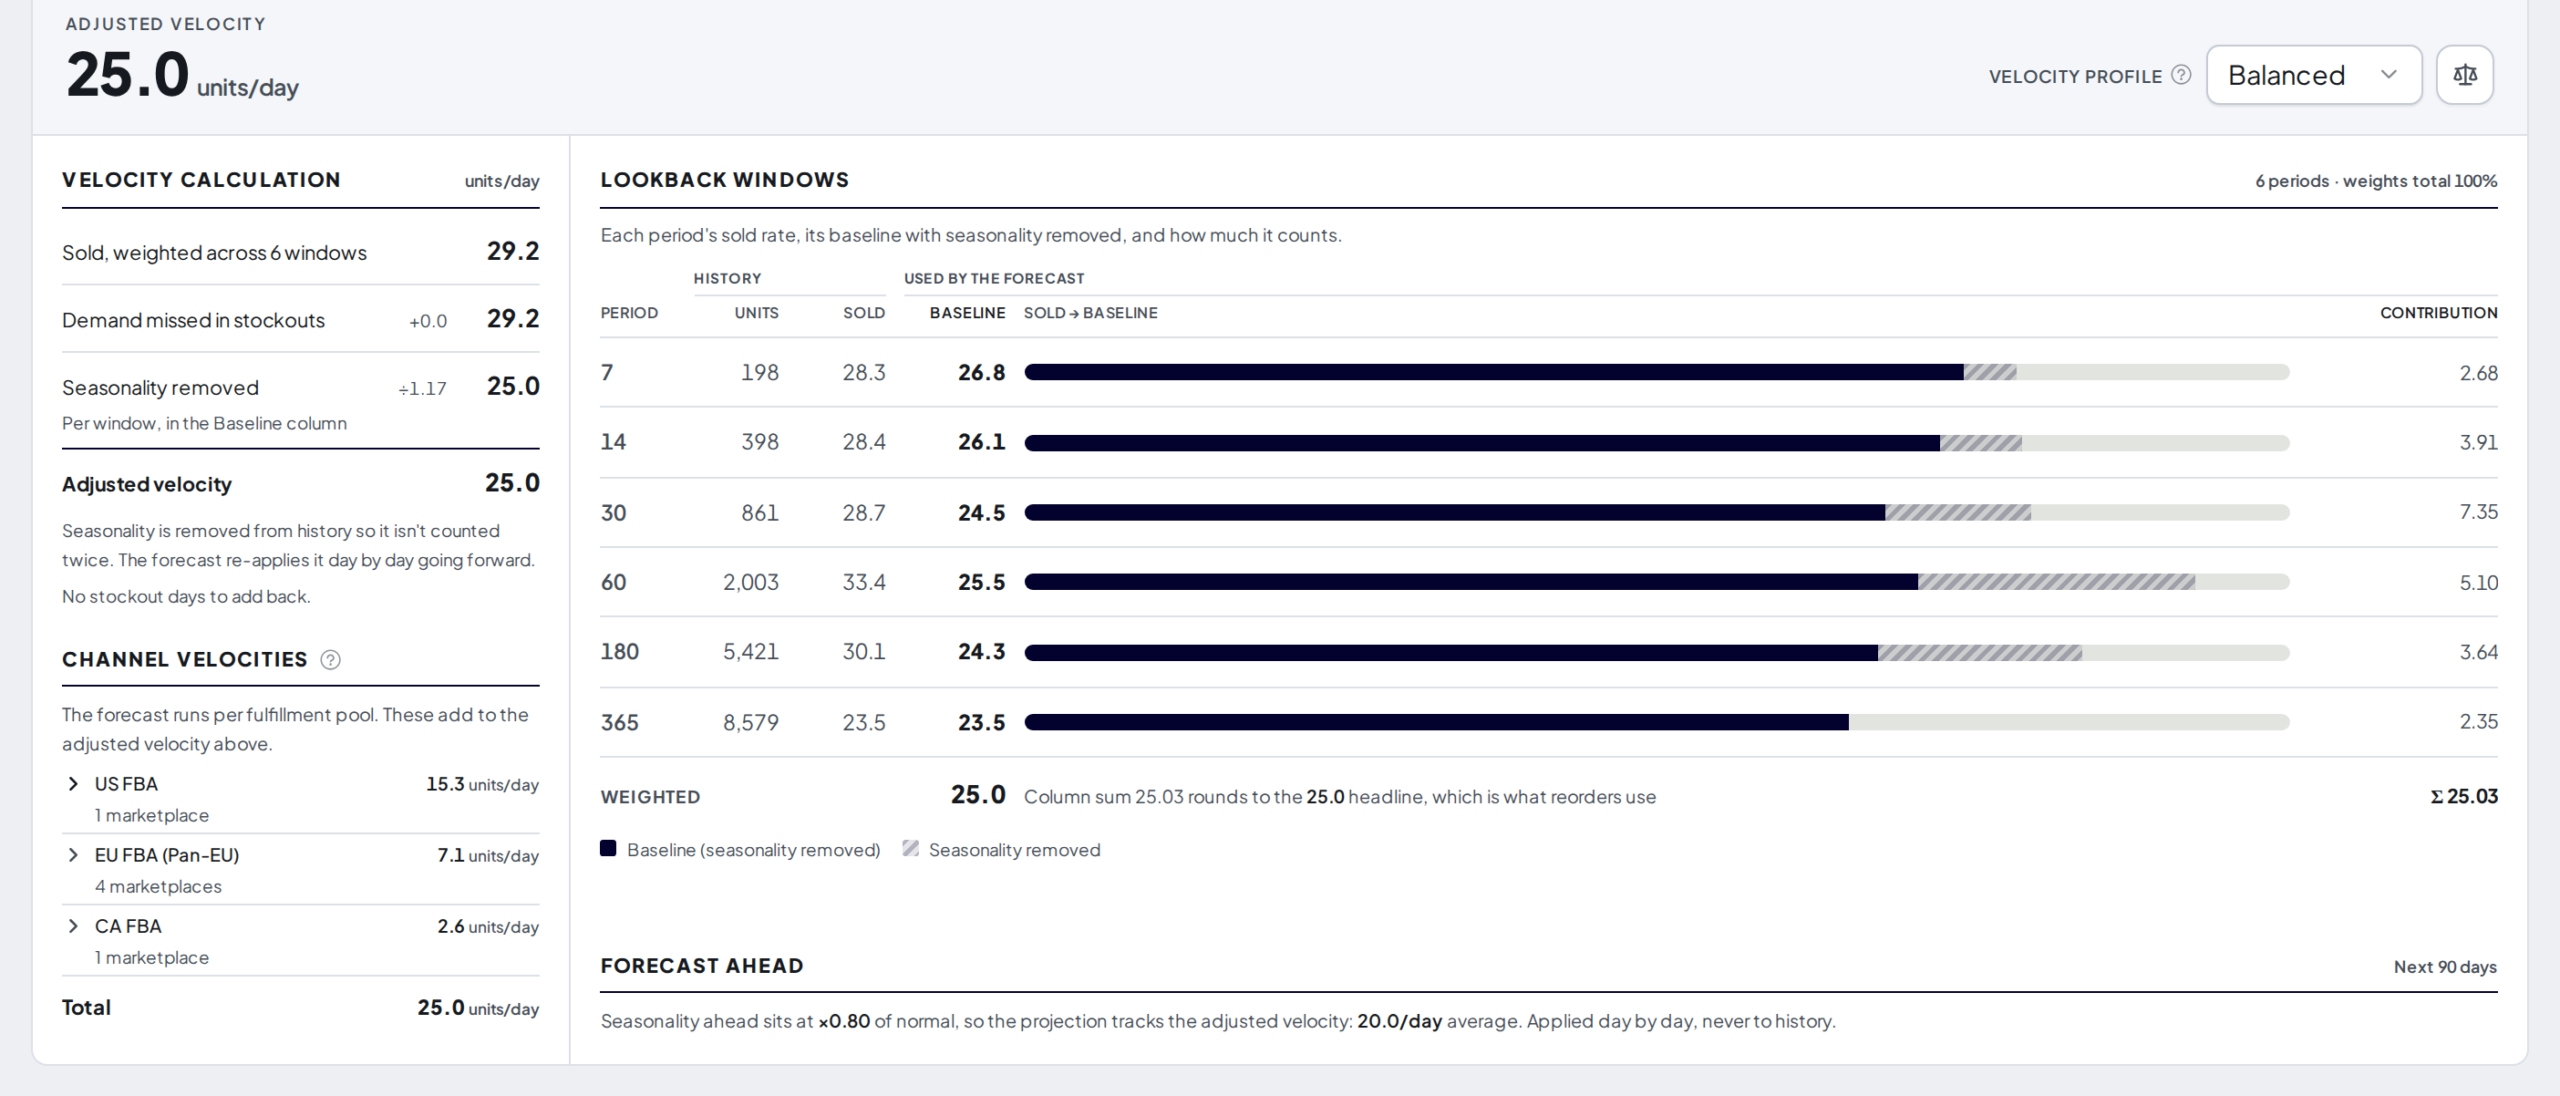
Reading the calculation from top to bottom:
- Sold, weighted across 6 windows. Your actual units sold per day, blended using the weights from your velocity profile.
- Demand missed in stockouts. Days when you were out of stock are filled in, so a stockout does not make Profit Hawk under-order. This step only ever adds.
- Seasonality removed. If the product has a primary keyword, the season is divided back out of your history. See below for why.
- Adjusted velocity. The result, and the number every reorder recommendation uses.
Every step is shown even when it changes nothing, at +0.0 or ÷1.00, so you can tell that stockouts and seasonality were both checked rather than skipped. A sentence under the calculation says which it was, for example "No stockout days to add back."
The Baseline column shows the same per window, and Contribution shows how much each window adds to the headline. Multiply a window's Baseline by its Weight and you get its Contribution, and those add up to the headline, so you can check the whole calculation by hand.
You may also see a line called Not yet in the demand estimate. Your sold rate counts every order, but the demand estimate is recalculated on a schedule, so it can trail your newest orders. It also leaves out MCF orders on any Sales Channel where you have excluded them under Settings, Forecast Settings.
Very slow movers show "less than 0.1"
A product selling a few units a month runs below 0.1 units a day, and one decimal place cannot tell that apart from selling nothing. On the inventory table, its per-channel columns, their hover cards and the Sales Velocity panel, these products show <0.1 rather than a rounded 0.0 or 0.1. A product that genuinely sold nothing still shows 0.0, because that is a different fact and worth stating plainly.
Because <0.1 is a bound rather than a figure, the Contribution column is hidden on these products. You cannot multiply a "less than" by a weight and check the answer by hand, and a column you cannot check is worse than no column.
When there is nothing to calculate yet
Rather than showing a row of zeros you have to interpret, the Sales Velocity panel names the reason:
- Every Sales Channel is switched off. Your history is untouched and comes straight back when you turn one on. Waiting will not change anything, so the panel says that instead of asking you to wait for more data.
- The forecast has not run for this product yet. New products get their first forecast on the next nightly run. Until then the windows still show what you actually sold, and everything the forecast produces waits.
- Only part of the product is forecast. A Sales Channel you added recently counts in Sold straight away and joins the forecast on the next run. Until it does, the panel says that those sales sit outside the adjusted velocity, so you are not left reading the gap as something else.
Seasonality adjustment
If a product has a primary keyword set, Profit Hawk pulls historical search volume for that keyword and uses it to adjust the daily forecast. Weeks with high search interest scale demand up; quiet weeks scale it down.
Choose a broad keyword that reflects the buying pattern for the category, not a specific listing term. "Yoga mat" captures category seasonality better than "extra thick blue yoga mat" because there is far more search history to draw on.
Seasonality is applied once, going forward, so it is also removed from your history first. If your last few weeks ran 10% above this product's own yearly average, your recent sold rates already carry that boost. Leaving it in and then applying the seasonal curve again would count the same peak twice and over-order. This is why the adjusted velocity on a product in its hot season sits below the sold rates in the table above it, and it is the largest reason the two numbers differ.
If you do not set a keyword, the forecast is a flat projection of weighted velocity with no seasonal adjustment.
Forecasted daily demand
The result of velocity + seasonality is a per-day demand forecast for each product, for each marketplace pool, projected 90 days into the future. You can see this on the product detail page as a forecast chart.
This forecast is the input to every other calculation in the system:
- The Days of Supply column on the Inventory Overview is calculated by walking forward day by day until current inventory plus inbound runs out at the forecasted demand
- The Stockout Date is the day that walk hits zero
- The Order Quantity recommendations are sized to bring projected inventory back up to your max days of stock target
- The Aged Inventory Analyzer and Storage Breakdown fee projections use this forecast for each SKU's sell-through, extended past the 90-day horizon by the keyword's seasonality pattern, so lifetime fees and removal recommendations reflect when a seasonal product actually sells
Lead times
Lead time is how long it takes to get inventory from your supplier to Amazon. It is broken into stages on the product:
| Stage | Default | Description |
|---|---|---|
| Production | 20 days | Time for your supplier to manufacture the order |
| Sea Freight | 20 days | Ocean transit (used when shipping method is Sea) |
| Air Freight | 10 days | Air transit (used when shipping method is Air) |
| Customs | 5 days | Customs clearance |
| Ground | 20 days | Domestic ground transport to prep or Amazon |
| Prep | 5 days | Labeling, inspection, prep before check-in |
The total lead time is the sum of the applicable stages. This drives the Order By date in supplier reorder recommendations: Profit Hawk works backward from the projected stockout date by the total lead time so the order arrives in time.
For warehouse-to-FBA transfers, Profit Hawk uses transfer-specific lead times (transit + prep) which can be set per warehouse-marketplace pair. See Product Settings for where to configure them.
Safety stock
Safety stock is the buffer Profit Hawk builds in to handle demand spikes and supplier delays. It is not a static number; it scales with each product's actual demand variability and lead time variability.
See Safety Stock for the full details on how it is calculated and how to tune the ABC classification that controls aggressiveness.
Reorder quantity
When the math says a product needs a reorder, Profit Hawk sizes the order using your min and max days of stock:
- Min days of stock (default 30) is the floor. When projected inventory dips below this number of days of supply, a reorder is triggered.
- Max days of stock (default 90) is the ceiling. The recommendation aims to bring inventory back up to this level after the order lands.
The raw recommendation is then rounded up to the nearest case quantity and to the MOQ if those are set, so you only see realistic numbers your supplier will accept.
When forecasts refresh
Forecasts recompute automatically:
- Daily, on a schedule, after data syncs from Amazon
- Whenever you change a setting that affects the forecast (lead time, days of stock, MOQ, velocity profile, primary keyword)
- On demand when you click Refresh Forecasts on the Inventory Overview toolbar
Recomputes typically take 10 to 15 minutes. The page will update automatically once they finish.
What can throw forecasts off
The model is only as good as its inputs. Common things that distort forecasts:
- Product was out of stock for an extended period. Sales velocity reflects what shipped, so a long stockout pulls velocity down. Profit Hawk does some interpolation to compensate, but extreme stockouts can still bias the result.
- Promotions or external traffic spikes. A one-week sale can pull the Responsive profile into thinking demand has doubled. Switch to Balanced or Stable for products with sudden, temporary spikes.
- Lead times that are wrong. A lead time too low pushes the Order By date too late. A lead time too high makes recommendations come too early. Update lead times after every supplier change.
- Missing seasonality keyword. If a product has clear seasonal patterns and no keyword is set, the flat forecast will be wrong on both shoulders of the season. The aged-inventory and storage fee projections also fall back to a flat sales pace for that product.
If a forecast looks off, see Forecast Looks Wrong for a structured way to diagnose it.
Related
Forecast Settings
Set your coverage defaults, MCF handling, and cross-border FBA programs.
Safety Stock
How Profit Hawk calculates the safety buffer per product.
Replenishment Recommendations
How recommendations show up in the app and how to use them.
Product Settings
Configure lead times, days of stock targets, and velocity profiles.
Forecast Looks Wrong
Diagnose unexpected forecasts step by step.