

Aged Inventory Analyzer
See which SKUs are racking up Amazon aged-inventory surcharges, how much cash is stuck in aging stock, and what to do about each one.
Amazon charges a monthly aged-inventory surcharge on FBA units that sit in fulfillment centers too long, and the fee climbs the longer stock ages. The Aged Inventory Analyzer shows every SKU that is being surcharged (or is about to be), how much cash is tied up in that aging stock, and a recommended next action for each one, sorted so the most expensive problems sit at the top.
Opening the analyzer
Go to Aged Inventory in the left navigation to open the Aged Inventory Analyzer. It opens for one sales channel at a time, so the first thing to check is which channel you are viewing (see Choosing a sales channel).
Every money figure on this page (surcharges, cash tied up, inventory value) is shown in the selected sales channel's local currency.
What the summary cards show
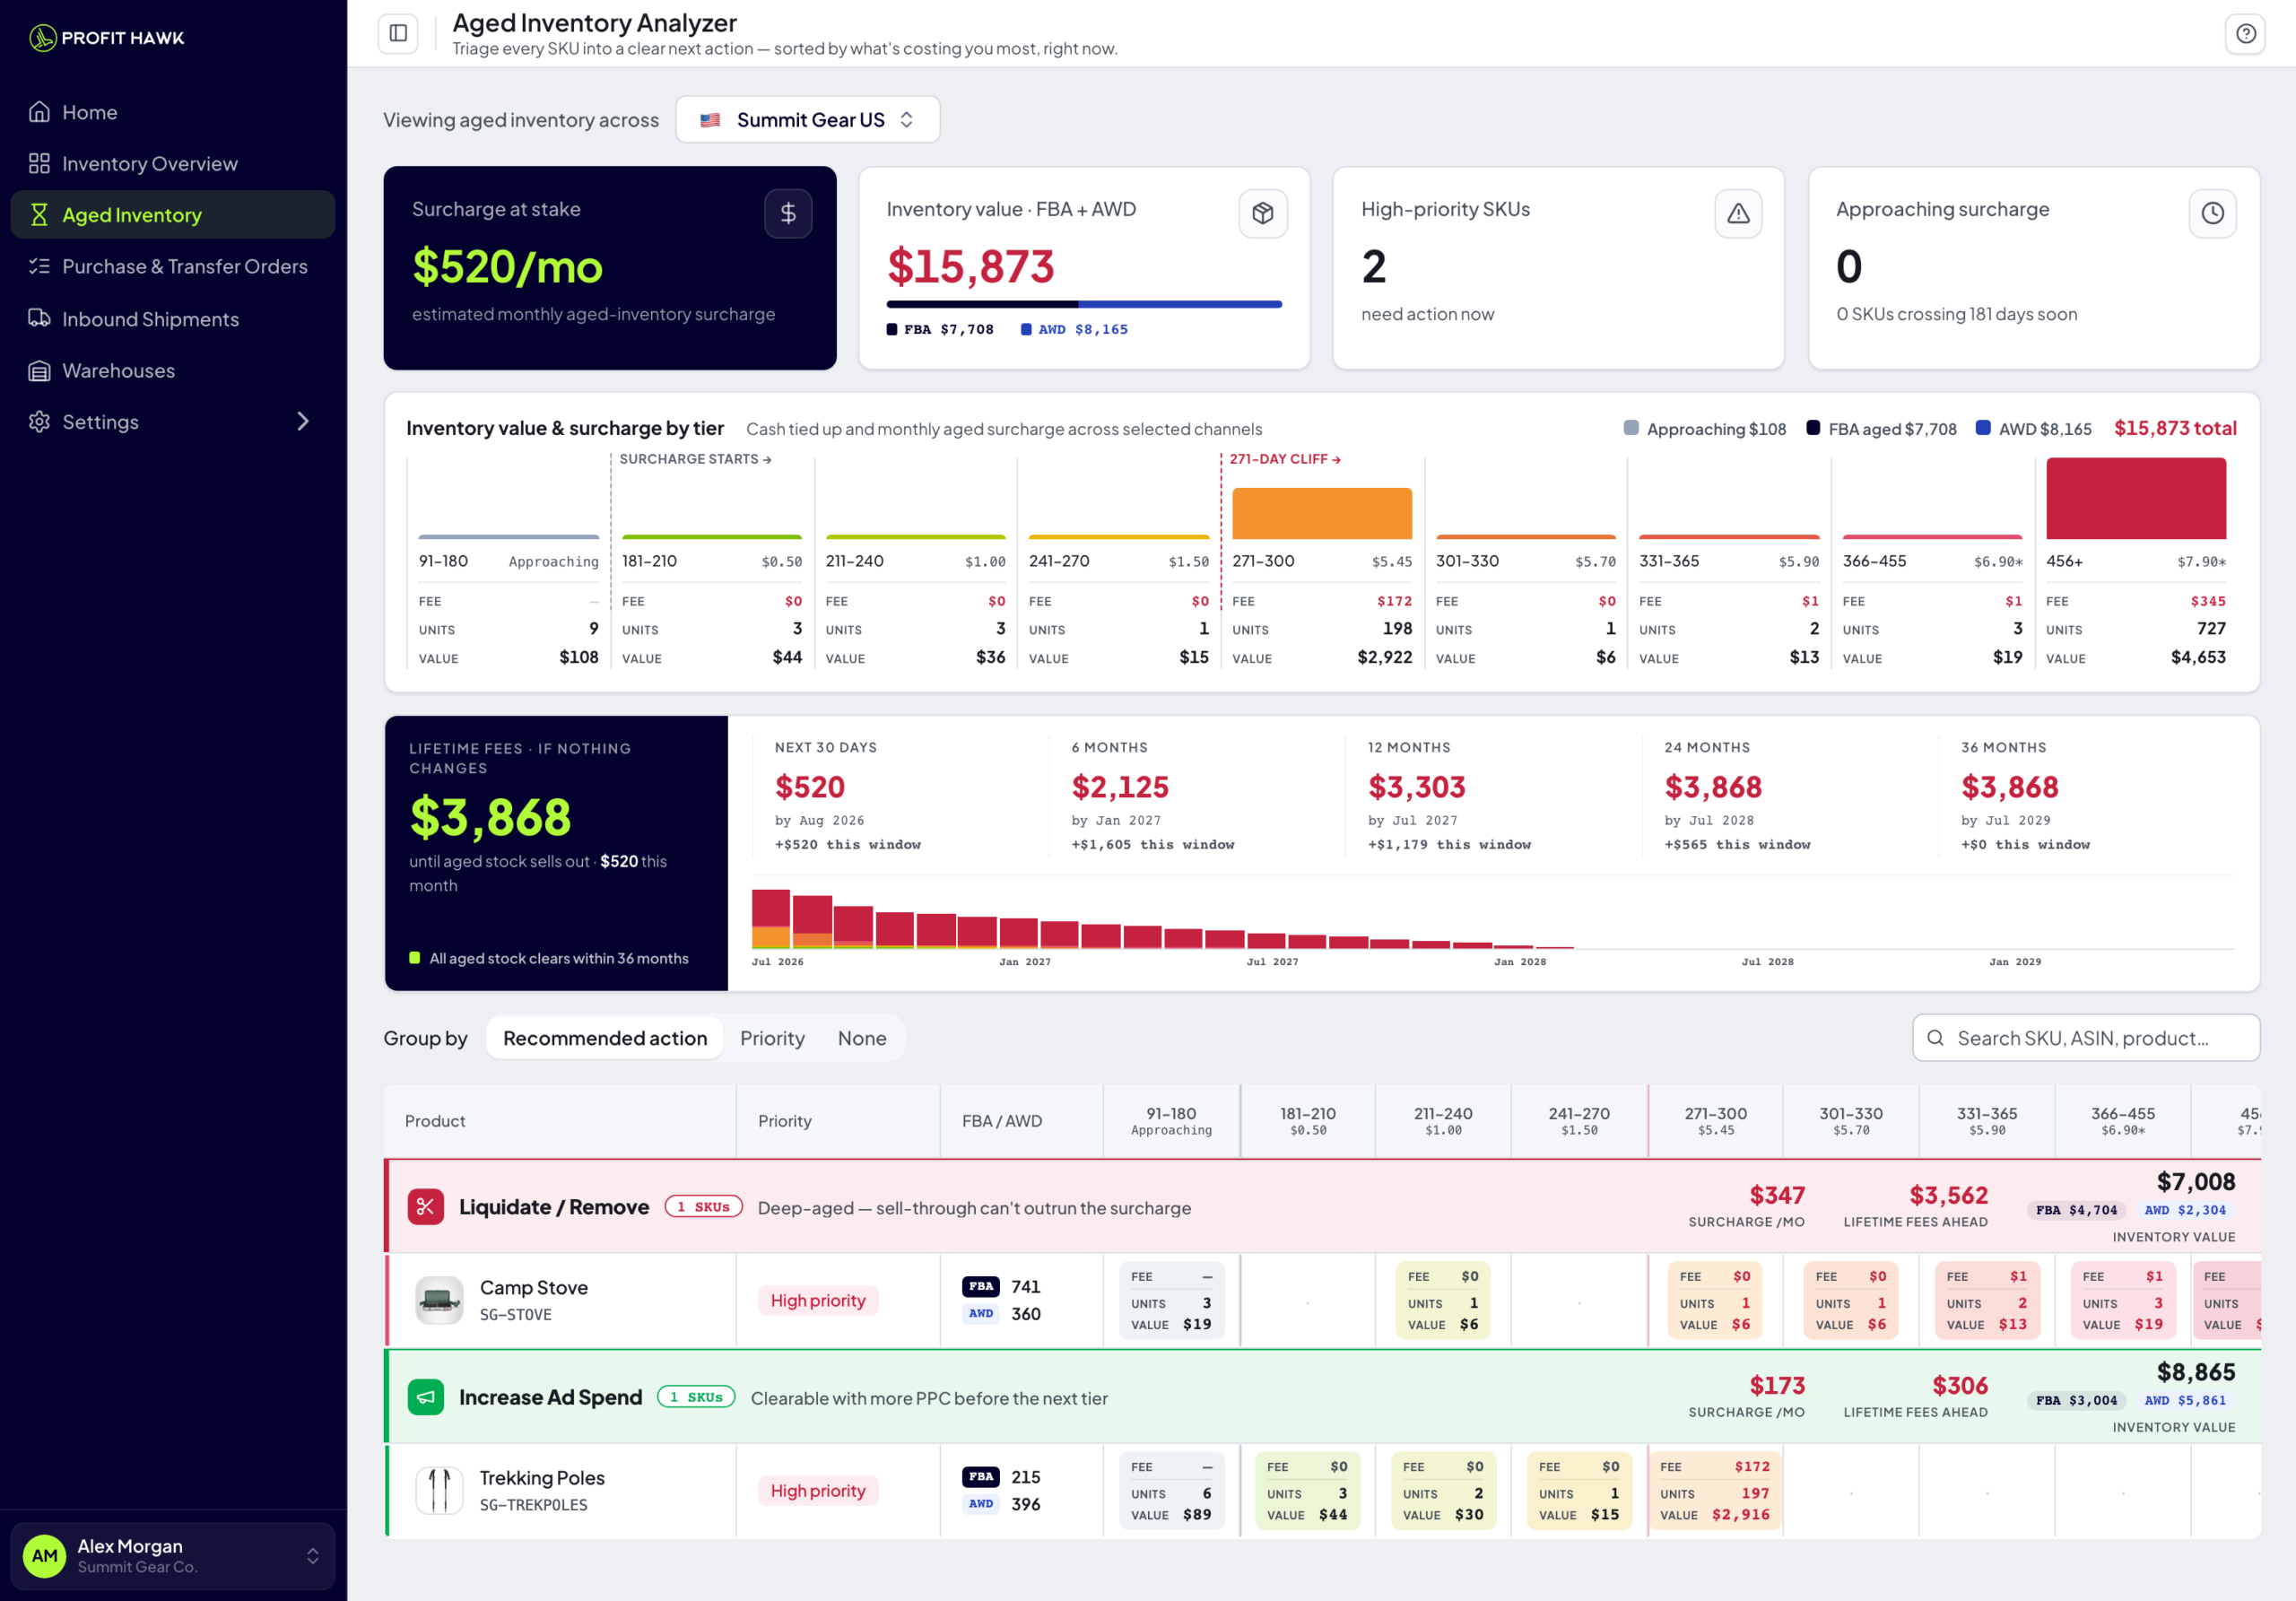
Across the top, four cards give you the headline numbers for the selected channel:
- Surcharge at stake: The estimated aged-inventory surcharge you will pay next month at the current aging.
- Cash tied up in aged stock: The inventory value of every unit aged 181 days or more (units multiplied by your unit cost).
- High-priority SKUs: How many SKUs need action now.
- Approaching surcharge: How many SKUs are close to crossing the first surcharge threshold at 181 days.
Below the cards, the Inventory value & surcharge by tier chart breaks your aging stock into Amazon's surcharge age bands. Each band shows its fee, unit count, and inventory value, and a marker calls out the 271-day cliff (explained next).

How the aged-inventory surcharge works
Amazon assesses the surcharge every month based on how many days each unit has been in a fulfillment center. The analyzer groups your aging units into these age bands:
- 181 to 210 days
- 211 to 240 days
- 241 to 270 days
- 271 to 300 days
- 301 to 330 days
- 331 to 365 days
- 366 to 455 days
- 456 days and over
The per-unit fee rises at every band, with a steep jump once stock passes 271 days. For US channels, the analyzer shows Amazon's current rate next to each band.
The 271-day cliff is where the rate increase is sharpest. SKUs sitting just before it are your best opportunity to act before the fee jumps.
Projecting your lifetime fees
Below the tier chart, the Lifetime fees panel answers one question: if you change nothing, what will this aged stock cost you before it sells out?
Profit Hawk takes every SKU's aging units, walks them forward month by month at the SKU's projected sell-through, and adds up the surcharge along the way. Stock keeps aging into more expensive bands as time passes. Units aged 91 to 180 days are included too, because they start being charged once they cross 181 days.
Projected sell-through is seasonal, not flat. It follows the SKU's demand forecast for the near term, and past the forecast it follows the seasonality of the product's primary keyword, the same pattern behind the forecast chart. A product that sells mostly from October through December is projected to clear mostly in those months, so its lifetime fee stops when the season clears the stock instead of climbing at a flat off-season pace. Seasonality changes when units are projected to sell, never how many sell across a year. Products without a primary keyword keep the flat trailing 30-day pace.

The panel shows:
- Lifetime fees: The projected total surcharge for the channel until the aged stock sells out, within a 36-month view. A "+" after the number means some stock will not sell out within 36 months at its projected pace, so the true total is higher.
- This month: The first month of the projection. It always matches the Surcharge at stake card above.
- Checkpoints: What you will have paid in total after the next 30 days and after 6, 12, 24, and 36 months, each with the amount added in that window.
- Month-by-month chart: Each bar is one month's projected surcharge, colored by the age bands the stock sits in that month, so you can watch fees ramp as stock crosses into more expensive bands. Hover any bar to see that month's total and its breakdown by age band.
The panel also calls out how many SKUs will not sell out at their projected pace, or confirms that all aged stock clears within 36 months.
The projection assumes you do nothing: no price changes, no extra advertising, no removals. It is the cost of waiting, not a forecast of what you will pay after you act on the recommendations.
Reading the table
The table lists one row per SKU. Click any row to open that product on its Aged tab, already set to the channel you are viewing, where you can work out how many units to remove (see Deciding How Much Aged Stock to Remove).
Working left to right, the key columns are:
- Product: The product name and SKU.
- FBA / AWD: On-hand units in FBA and in AWD. AWD applies to US channels only (see Amazon Warehousing & Distribution).
- Age band columns (181-210 through 456+): For each band, the fee, units, and inventory value.
- Aged units: Total units aged 181 days or more.
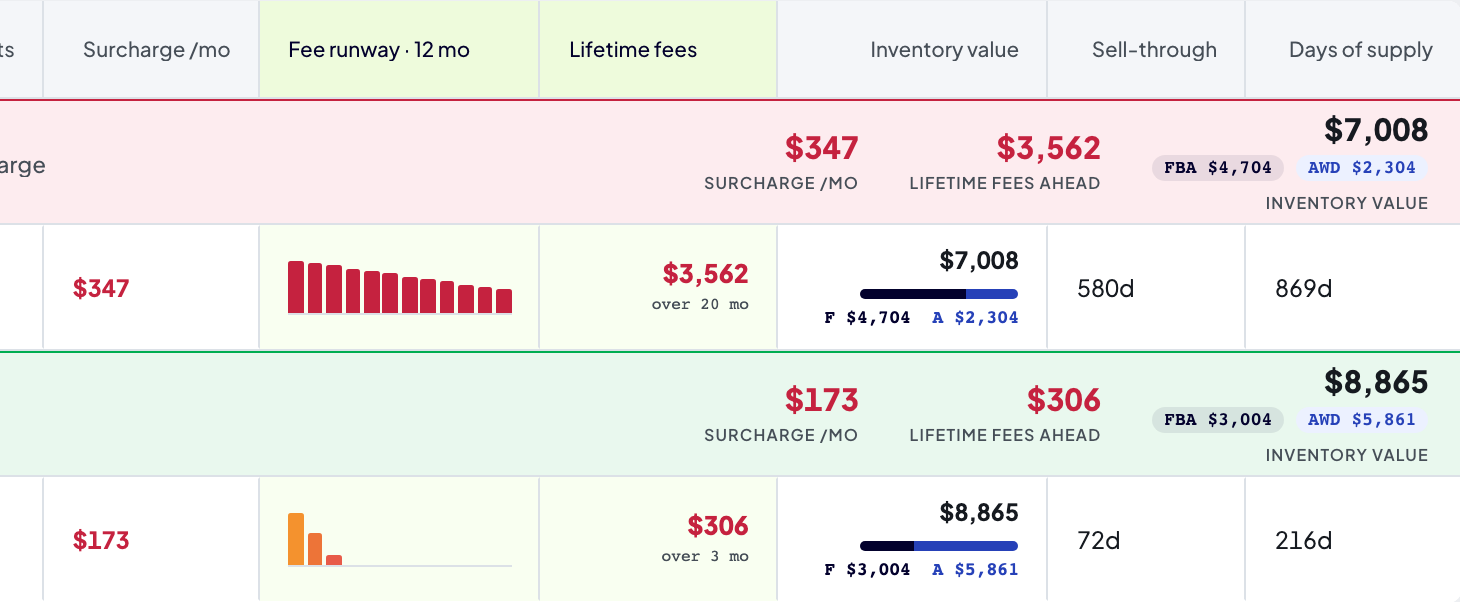
- Surcharge /mo: The estimated monthly surcharge for this SKU.
- Action fees: The estimated cost per unit to get the stock out of Amazon, shown as Removal (units shipped back to you) and Disposal (units destroyed). See Estimating removal and disposal costs.
- Fee runway · 12 mo: A 12-bar chart of this SKU's projected monthly surcharge for the next year, colored by age band. Bars step up and shift toward red as the stock crosses into more expensive bands. A dash means no fees ahead.
- Lifetime fees: This SKU's projected total surcharge until its aged stock sells out, with how long that takes (for example "over 9 mo"). A "+" with "36 mo+ & climbing" means the stock will not sell out within 36 months at its projected pace.
- Inventory value: The inventory value of this SKU's aged FBA units plus its AWD stock.
- Sell-through and Days of supply: Based on the SKU's trailing 30-day sales pace.
Every inventory value figure on this page (including the Cash tied up in aged stock card) is based on your unit costs. If a product has no cost set, its value shows as zero. See Product Costs to add costs.
Estimating removal and disposal costs
Once a SKU is deep into the surcharge bands, the real question is whether to keep paying the monthly fee or pay once to get the stock out. The Action fees column puts that one-time cost next to the recurring surcharge so you can compare the two without leaving the page.
It shows two figures, both per unit:
- Removal: What Amazon charges to pull each unit from the fulfillment center and ship it back to an address you choose.
- Disposal: What Amazon charges to destroy or recycle each unit for you.
Amazon does not publish a per-SKU price before you place the order, so Profit Hawk estimates one from the marketplace's published removal rate card using two things it knows about the product: its size tier (standard or oversize) and its shipping weight. Larger and heavier units cost more to remove, and above the top weight band most marketplaces add a per-pound or per-kilo charge.
Removal is estimated in 22 marketplaces, each priced from its own rate card in its own local currency. Disposal is priced on a separate schedule that only matches removal in the US, so outside the US you will see a removal estimate with a dash for disposal until Amazon's local disposal rates are added.
Where Amazon has waived the fee
In some marketplaces Amazon currently charges nothing for removals. Those SKUs show a real zero rather than a dash, and the Aged tab on the product spells out that the fee is waived, along with the end date when the waiver has one.
To judge whether removing is worth it, multiply the per-unit fee by the SKU's Aged units and compare that one-time cost with its Lifetime fees. When the projected surcharge is the bigger number, getting the stock out early is usually the cheaper path. The Aged tab does this comparison for you and works out the best quantity to remove.
When a dash appears instead
Profit Hawk shows a dash rather than a number whenever it would have to guess, because a confident wrong figure in a cash decision is worse than no figure:
- Amazon has not reported the product's size tier, and the marketplace charges different rates for standard and oversize. This usually clears up once Amazon's fee and inventory reports catch up with a newly listed SKU.
- Amazon has not reported a shipping weight, and the marketplace prices by weight. A unit of unknown weight could fall in any band, so no estimate is made.
- The marketplace has no published rate card yet. Poland is the current example: it bills in zloty on its own schedule, which is not modeled yet.
- The rate depends on something Amazon does not tell us. Türkiye prices removals by whether a unit stacks, which is not the same as its size tier, so it stays unestimated.
In every one of these cases you can enter the fee yourself on the product's Aged tab, and all of that tab's cash figures will use your number.
These figures are estimates from Amazon's published rates, not quotes from your account, and outside the US they have not been verified against Seller Central. Confirm the actual cost in Seller Central before placing a large removal or disposal order.
Recommended actions
Profit Hawk assigns each SKU one of four actions and a priority (High, Medium, or Low), so you know not just what is aging but what to do about it:
- Liquidate / Remove: Stock is deep into the surcharge bands and selling too slowly to clear before the fees pile up. Consider a liquidation or removal order. The Action fees column shows what removing or disposing of each unit would cost.
- Increase Ad Spend + Price Reduction: The SKU is surcharged (or about to be) and is not moving fast enough on its own. It usually needs both a price cut and more advertising to clear in time.
- Increase Ad Spend: The SKU can realistically be cleared with more advertising before it hits the next band.
- Healthy: The SKU is aging within a comfortable range and needs no action right now.
The recommendations run on the same seasonal sell-through as the fee projection, so a SKU heading into its selling season is judged on the sales that season is expected to bring, not on today's off-season pace alone. A SKU with no recent sales can still clear (and avoid the Liquidate / Remove flag) when its demand forecast shows sales ahead.
By default the table groups SKUs by recommended action, with the most urgent groups first. Each group header shows that group's total monthly surcharge, its projected lifetime fees, and its total inventory value.
Switch how rows are grouped
Use the Group by control to group by Recommended action (default), Priority, or None for a flat list.
Work the most expensive groups first
Start at the top. The list is ordered so the SKUs costing you the most, right now, are first.
Choosing a sales channel
The selector at the top of the page picks the sales channel you are analyzing. You view one channel at a time, and all figures use that channel's local currency.
If you run Pan-EU, your European marketplaces share one pooled inventory, so they appear as a single combined option ("EU FBA (Pan-EU)") rather than as separate channels. Channels that are not part of the EU pool (such as UK) stay as their own options.
Finding a specific SKU
Use the search box above the table to filter by product name, SKU, or ASIN. The table (and each group's totals) updates as you type.
Related pages
Deciding How Much Aged Stock to Remove
Work out the best quantity to remove for one SKU, checked against your Max FBA Days floor.
Storage Breakdown
Project your Oct-Dec peak storage bill, aged surcharges included, and see which cube drives it.
Product Costs
Add unit costs so cash tied up and inventory value are accurate.
Amazon Warehousing & Distribution (AWD)
How AWD on-hand is tracked alongside your FBA stock.
Inventory Overview
Your full inventory position across marketplaces.
Replenishment Recommendations
Reorder the right amount so stock does not age in the first place.
How Forecasting Works
The demand forecast and keyword seasonality behind the projected sell-through.