

Dashboard
A tour of the Profit Hawk dashboard: top-line KPIs, inventory value charts, and recommended reorders and transfers.
The dashboard is the first thing you land on after signing in. It pulls together the headline numbers for your business so you can see, at a glance, how sales are trending, where your inventory cash is sitting, and what you need to act on next. This page walks through each section.
Top-line KPIs
At the top of the dashboard, three cards summarize Orders, Revenue, and Ad Spend for the selected period, with a sparkline showing the trend and a percent-change indicator versus the previous period.
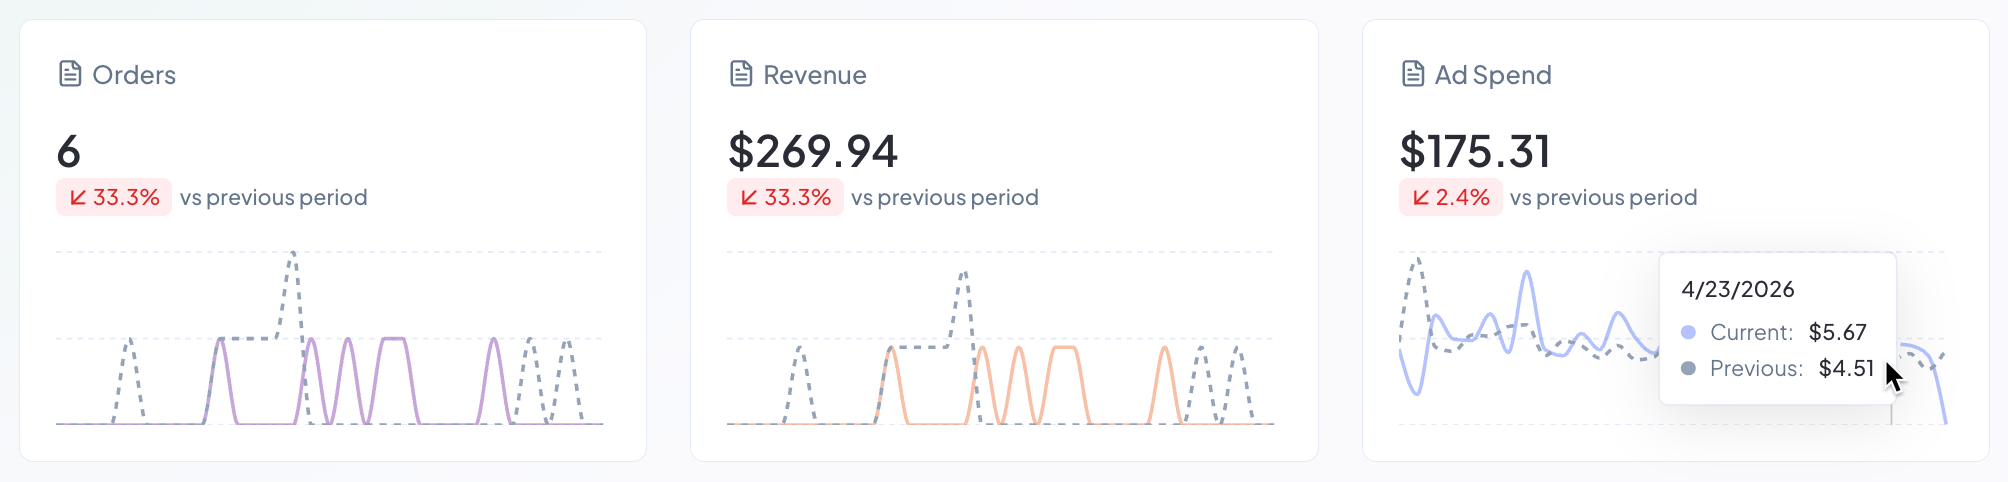
Use the dashboard's period selector (30 days, 90 days, and so on) to change the window these cards measure. The dashed line on each sparkline is the previous period, and the solid line is the current one, so you can spot whether things are trending up or down.
Inventory Value Over Time
The Inventory Value Over Time chart is a stacked bar chart showing the total cash value of your on-hand inventory each day, split by location. The legend chips above the chart show the current totals for each location bucket: Amazon (units in Amazon fulfillment centers), Inbound (units on active inbound shipments), and any external warehouses you have connected (for example, My 3PL).
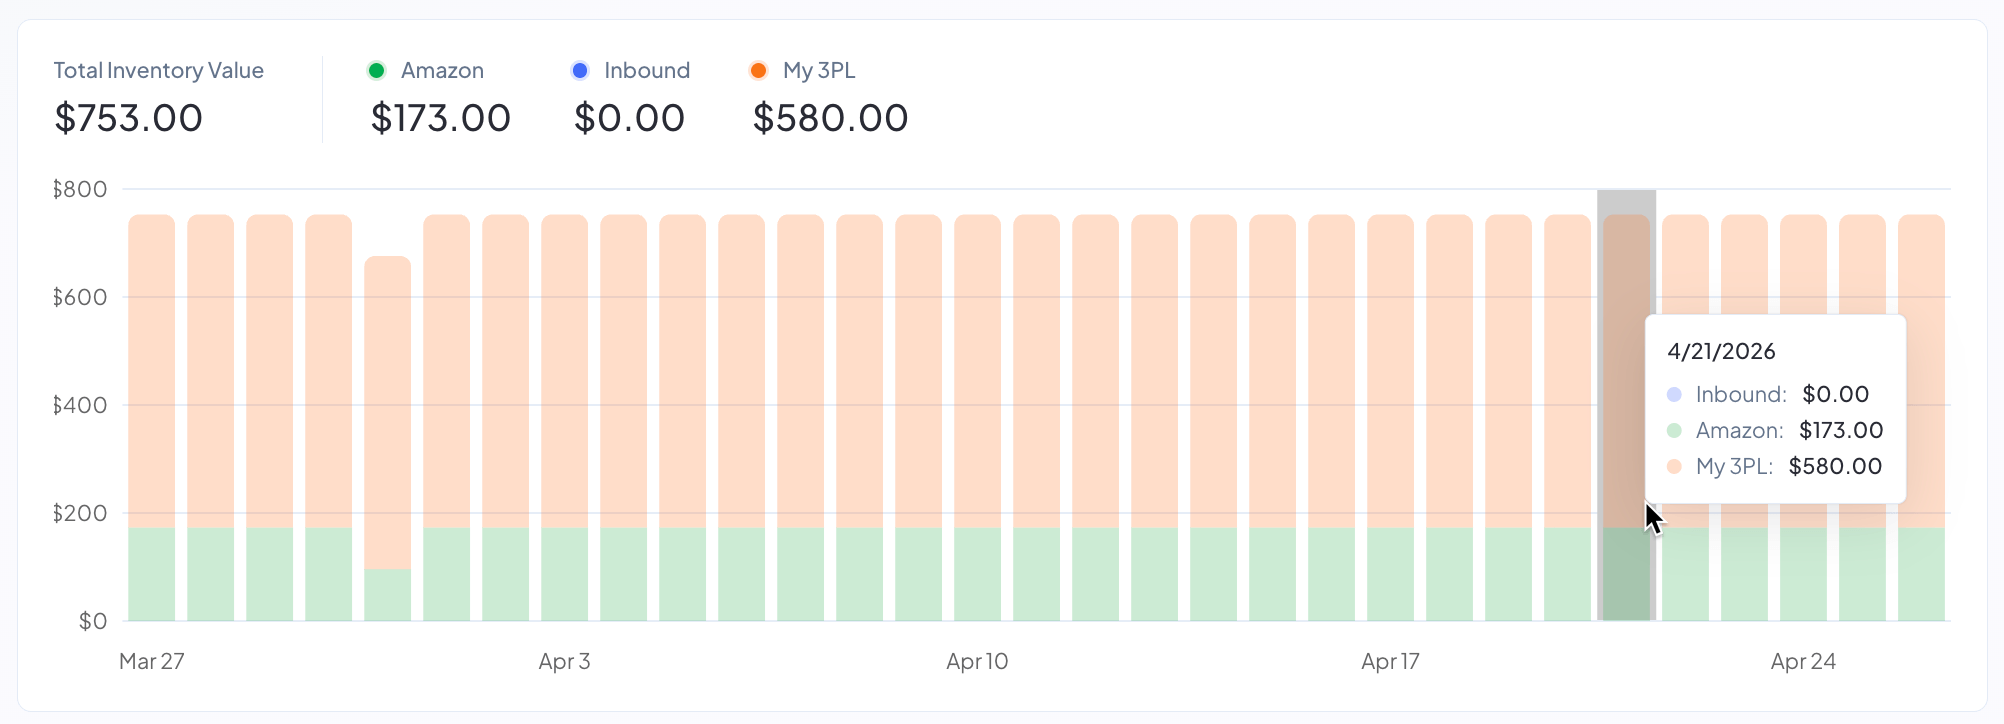
Hover any bar to see the breakdown for that day. Use this chart to spot inventory swings: a sudden drop usually means a large outbound shipment or a removal, and a spike usually means an inbound shipment was received.
Total Inventory Value by Product
To the right of the bar chart, the Total Inventory Value pie chart shows the same total cash value, but broken down by product instead of by location. The top 10 products show as individual slices and the rest roll up into a single "Other (N)" slice.
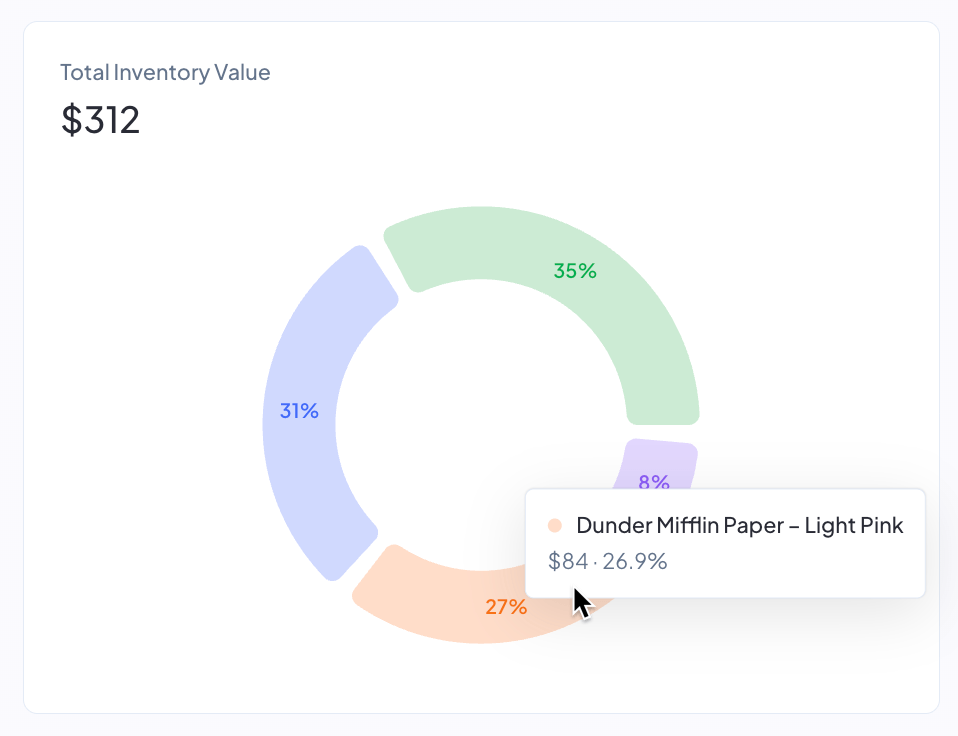
This view answers the question "which products are eating the majority of my working capital?" It is useful for prioritizing reorders, slowdowns, and promotions.
Learn more: Total Inventory Value by Product
Recommended Reorders and Transfers
The bottom section of the dashboard surfaces what needs your attention next. Four counters at the top show Supplier Orders ready to send, Transfers Needed to move inventory from your warehouses to FBA, products At Risk of stockout, and the Estimated Lost Revenue from those at-risk products. Below the counters, individual cards preview each recommended supplier order and transfer, including the supplier or warehouse, SKU count, unit count, and the date you should order by to avoid a stockout.
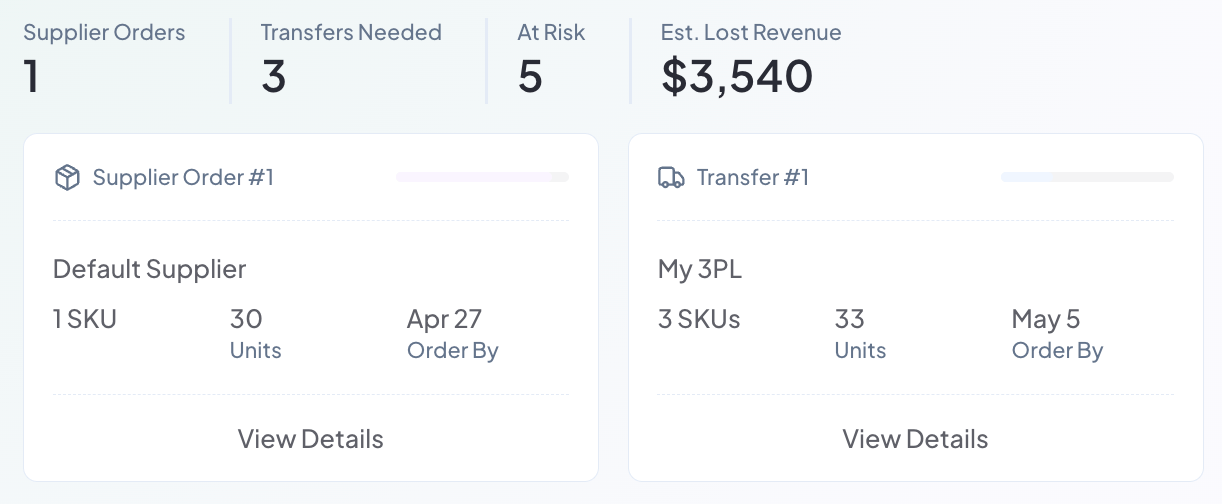
Click View Details on any card to drop into the full replenishment recommendations view, where you can adjust quantities and turn the recommendation into a purchase order or transfer.
Learn more: Replenishment Recommendations and Creating Purchase Orders