

Storage Breakdown
Project your Oct-Dec peak storage bill, see which cubic feet are running it up, and get view-only recommendations to cut it before rates flip.
On Amazon's US marketplace, monthly FBA storage rates roughly triple from October through December, right when most sellers hold the most stock (other marketplaces set their own rates, and Profit Hawk projects those from Amazon's own estimates for your account). The Storage Breakdown page projects what the upcoming peak quarter will cost under your current stock plan, shows exactly which SKUs (and which cubic feet) drive that bill, and recommends what to do about the worst offenders before peak rates start.
Opening the page
Go to Storage Breakdown in the left navigation. Like the Aged Inventory Analyzer, it shows one sales channel at a time (see Choosing a sales channel), and every money figure is in that channel's local currency. A chip in the top corner counts down the days until peak rates begin on October 1.
The projected peak bill
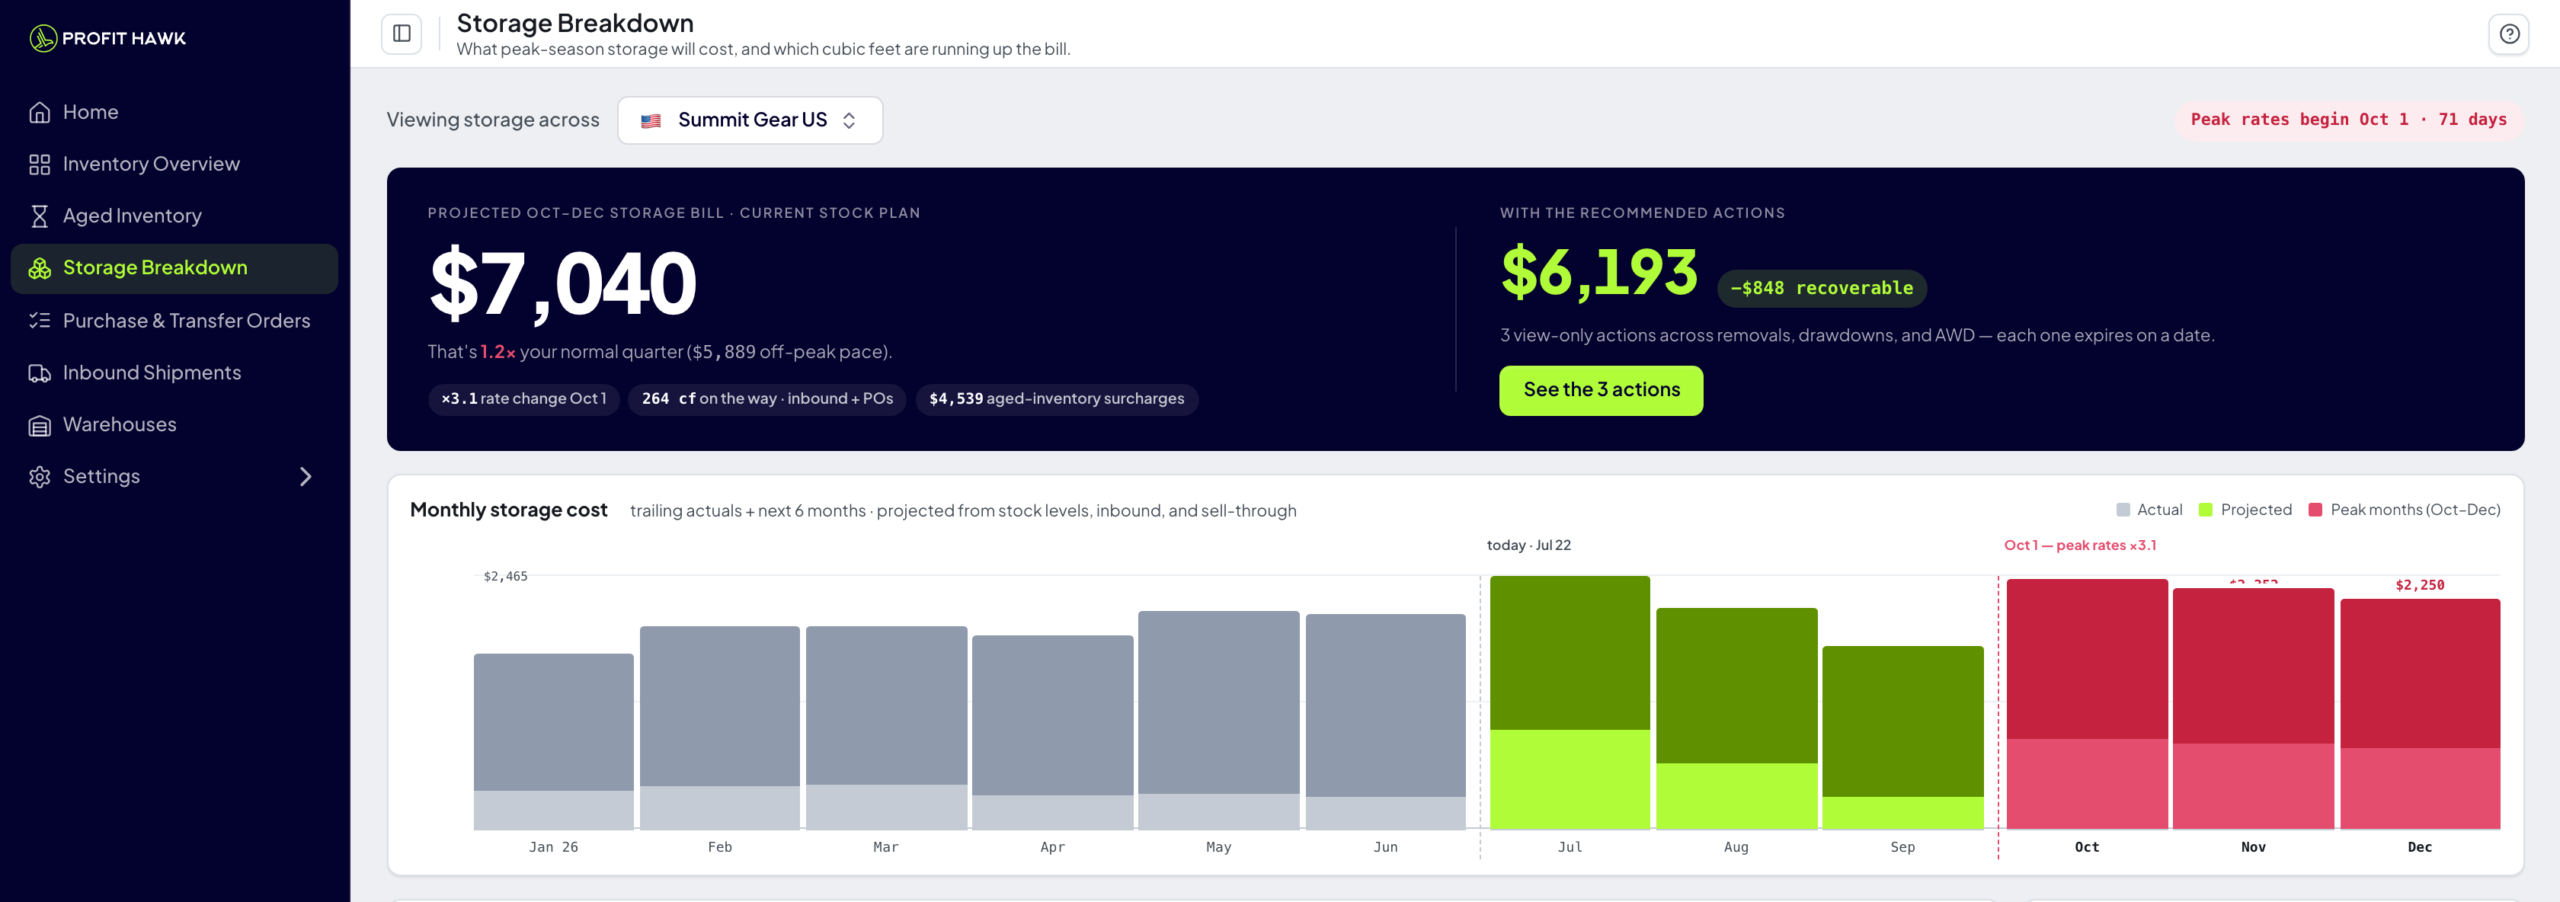
The dark panel at the top answers the headline question: what will October through December storage cost if you change nothing?
- Projected Oct-Dec storage bill: Your projected base storage fees plus aged-inventory surcharges for the peak quarter, at your current stock levels, current inbound, and projected sell-through.
- Compared to your normal quarter: If Profit Hawk has enough billed storage fees from your account history, the panel shows how many times larger the peak bill is than your typical off-peak quarter.
- Driver chips: Small chips call out what is pushing the number up, such as the October 1 rate change (US channels), the cube arriving from inbound shipments and purchase orders, and any aged-inventory surcharges included in the total.
- With the recommended actions: The right side shows what the same quarter costs if you take every recommended action, with the recoverable difference. Click See the actions to open the list.
The projection assumes you do nothing: projected sell-through, current inbound, no removals. It is the cost of waiting, not a forecast of what you will pay after acting on the recommendations.
Monthly storage cost chart
The chart puts the projection in context: up to six months of actual billed storage fees from your Amazon transactions, then six projected months, with a divider at today and a marker where peak rates begin. Peak months are highlighted, and every bar is drawn as a stack: the base storage fee below, with the aged-inventory surcharge as a darker segment on top, so you can see at a glance how much of each month's bill is surcharge.
Hover any bar to see its breakdown:
- Base storage: The monthly storage fee on your cube. For actual months, this is what Amazon billed minus any surcharge.
- Aged surcharge: The aged-inventory surcharge for stock that has been in fulfillment centers 181 days or more. Actual months show the surcharge Amazon actually billed.
- Arriving (projected months only): Units (and cubic feet) landing at FBA that month from inbound shipments and placed purchase orders.
Actual months come from the storage-related fee transactions Amazon posts to your account, attributed to the month the storage happened (Amazon bills a month in arrears).
The treemap: where that money sits
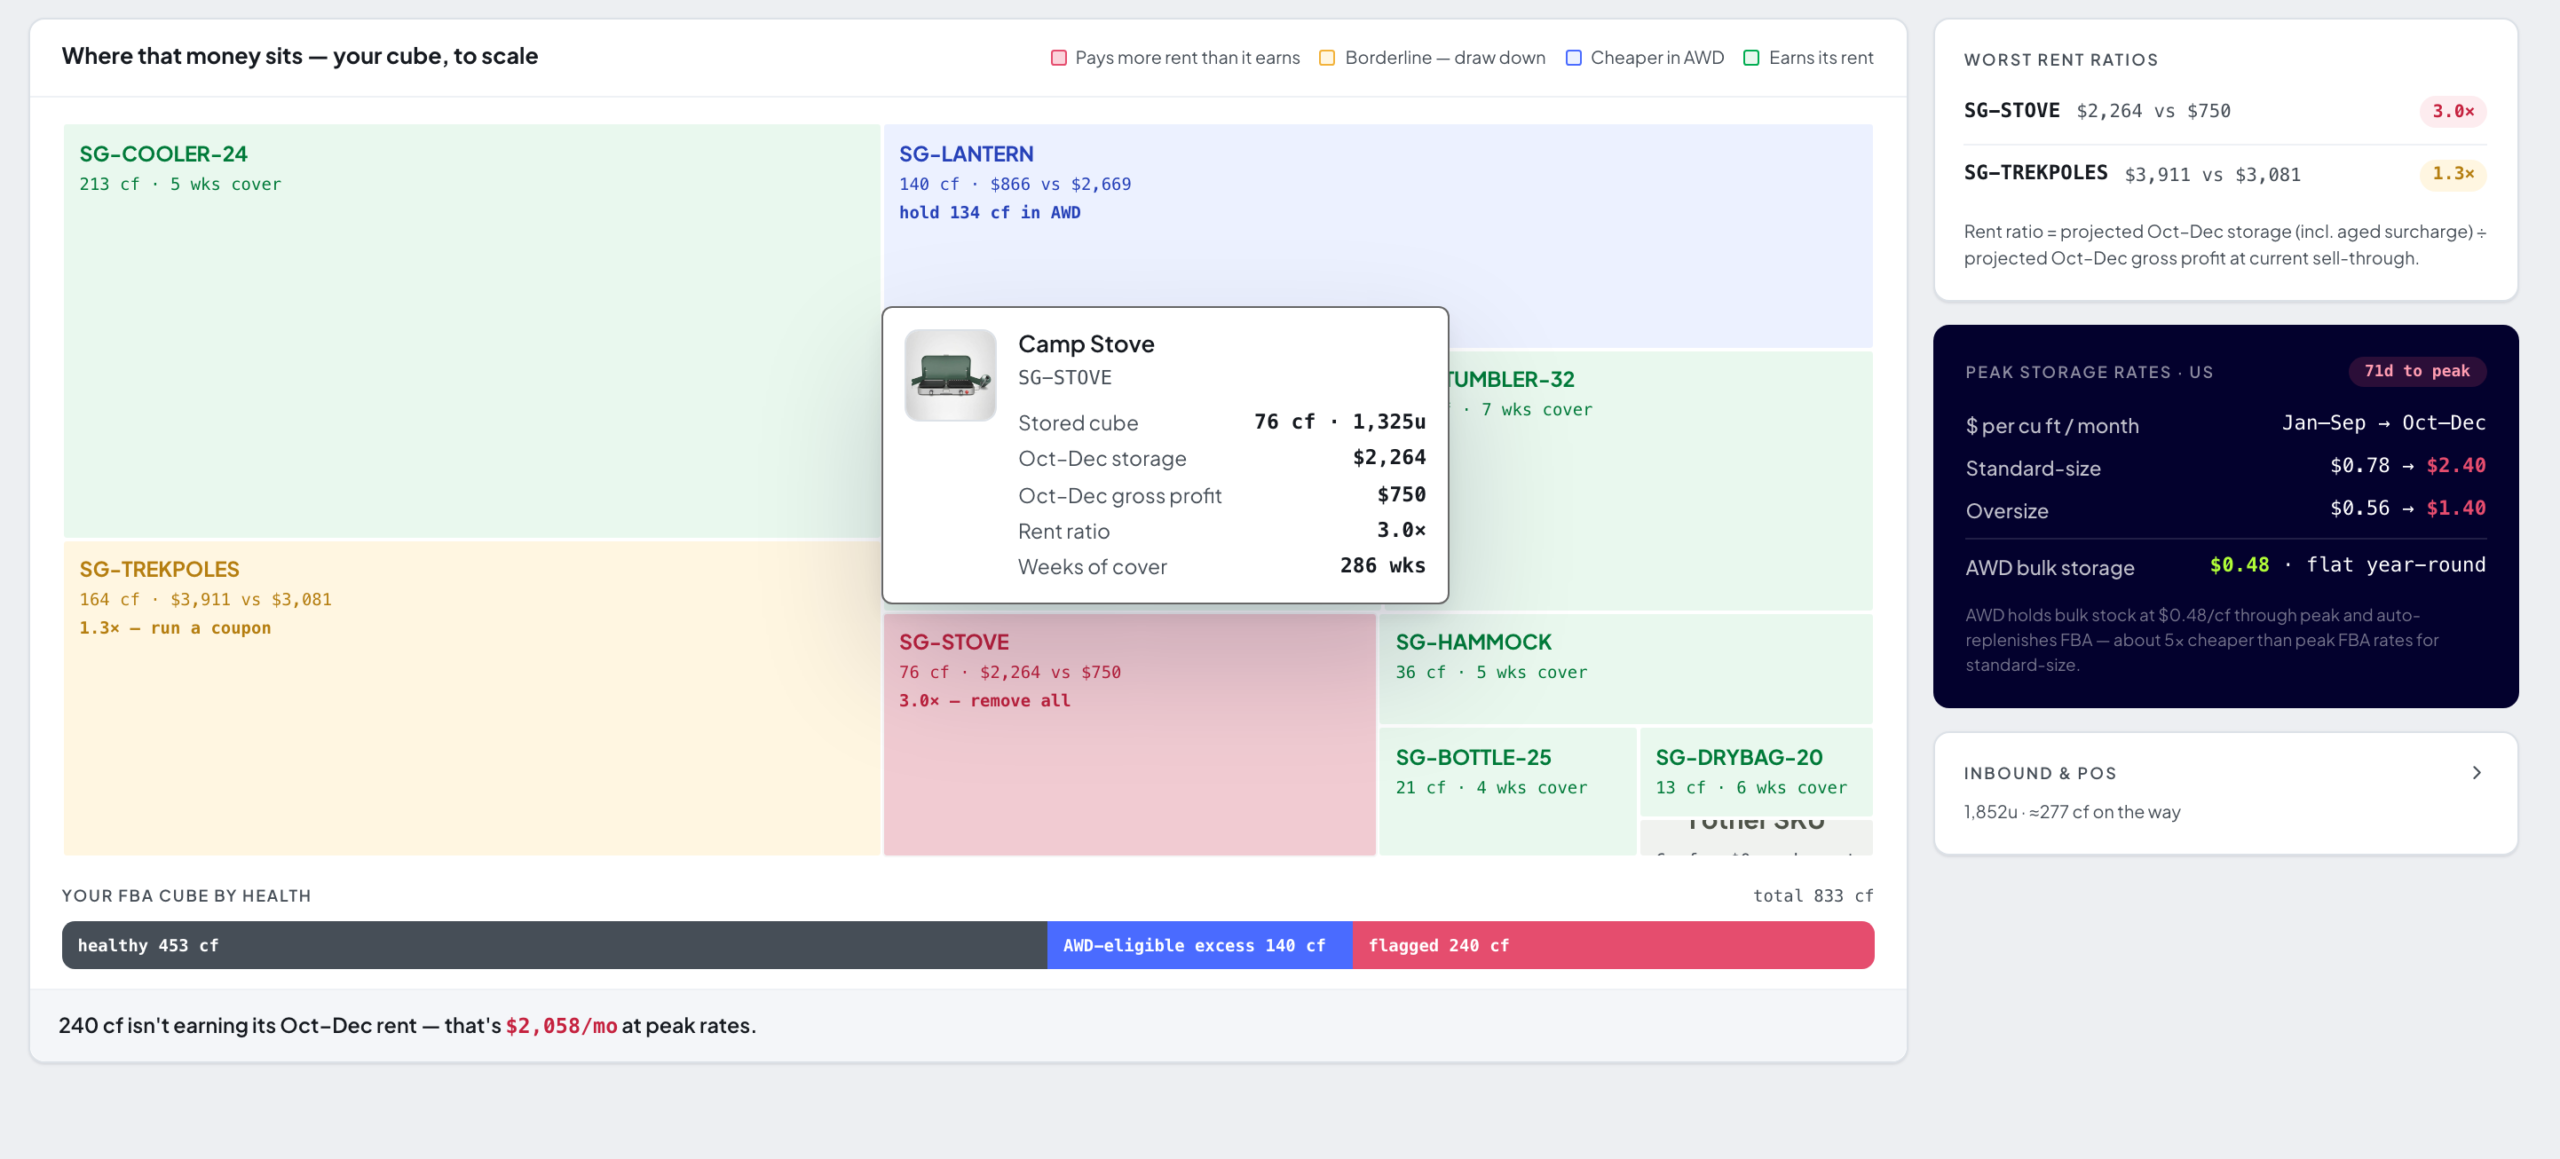
The treemap draws your stored cube to scale, one tile per SKU, so the biggest tiles are the SKUs occupying the most space. Each tile is colored by how well that space pays for itself:
- Pays more rent than it earns (red): Projected peak storage runs at least twice the SKU's projected peak profit, or the SKU pays rent with no sales at all, or it sells at a loss.
- Borderline, draw down (amber): Peak storage runs between one and two times peak profit. Worth trimming before rates flip.
- Cheaper in AWD (blue): The SKU earns its rent, but it holds far more cover than FBA needs, and the excess would be cheaper in Amazon Warehousing & Distribution. US standard-size SKUs only.
- Earns its rent (green): Storage is a small share of what the SKU makes. Fast movers that sell out before October show their weeks of cover instead of a peak fee.
Hover any tile to see the product card: stored cube, projected Oct-Dec storage, projected Oct-Dec gross profit, rent ratio, and weeks of cover. Click a tile to open the full product slide-out.
SKUs too small to draw individually are grouped into one "other SKUs" tile. Below the treemap, a composition bar totals your cube by category, and a footer strip totals what the flagged (red plus amber) cube costs per month at peak rates.
If Amazon has not reported a unit volume for some SKUs, a footnote below the treemap counts them. Their storage cannot be projected, so treat the totals as a floor rather than the complete bill.
Worst rent ratios
The Worst rent ratios list ranks your most expensive offenders. The rent ratio is:
Projected Oct-Dec storage (including aged surcharge) divided by projected Oct-Dec gross profit at projected sell-through.
A ratio of 3x means the SKU pays three dollars in peak storage for every dollar of gross profit it earns during the same window. SKUs with no sales, or that sell at a loss, are flagged with a label instead of a ratio because their rent has no earnings against it at all. Hover a row to see the same product card as the treemap tiles (stored cube, projected peak storage and profit, rent ratio, and weeks of cover), and click it to open the full product slide-out.
Inbound & POs
The Inbound & POs card sits at the bottom of the right-hand column, collapsed to a one-line summary of the units and cube on the way. Click the header to expand the full list of everything headed to FBA for the selected sales channel, soonest first:
- Shipments: Open FBA inbound shipments, using Amazon's delivery-window ETA where Amazon has reported one.
- POs and Transfers: Your active purchase orders and warehouse-to-FBA transfer orders, with an estimated arrival computed from the ship date plus your configured lead time. Estimated dates are marked with a tilde.
Each row shows the units, the estimated cubic feet, and where the stock is heading. Quantities already on a linked inbound shipment are not double counted against the order they came from. Click a shipment row to open that shipment's detail page in Inbound Shipments; a PO or transfer that covers a single SKU opens that product's slide-out.
A purchase order headed to AWD or a 3PL warehouse is listed with its destination so you can see it coming, but it is not billed as FBA storage in the projection. Only stock arriving at FBA affects the projected bill.
Everything FBA-bound in this card is already included in the projected months, so the chart and the peak bill reflect the stock you have coming, not just the stock you have today.
Recommended actions
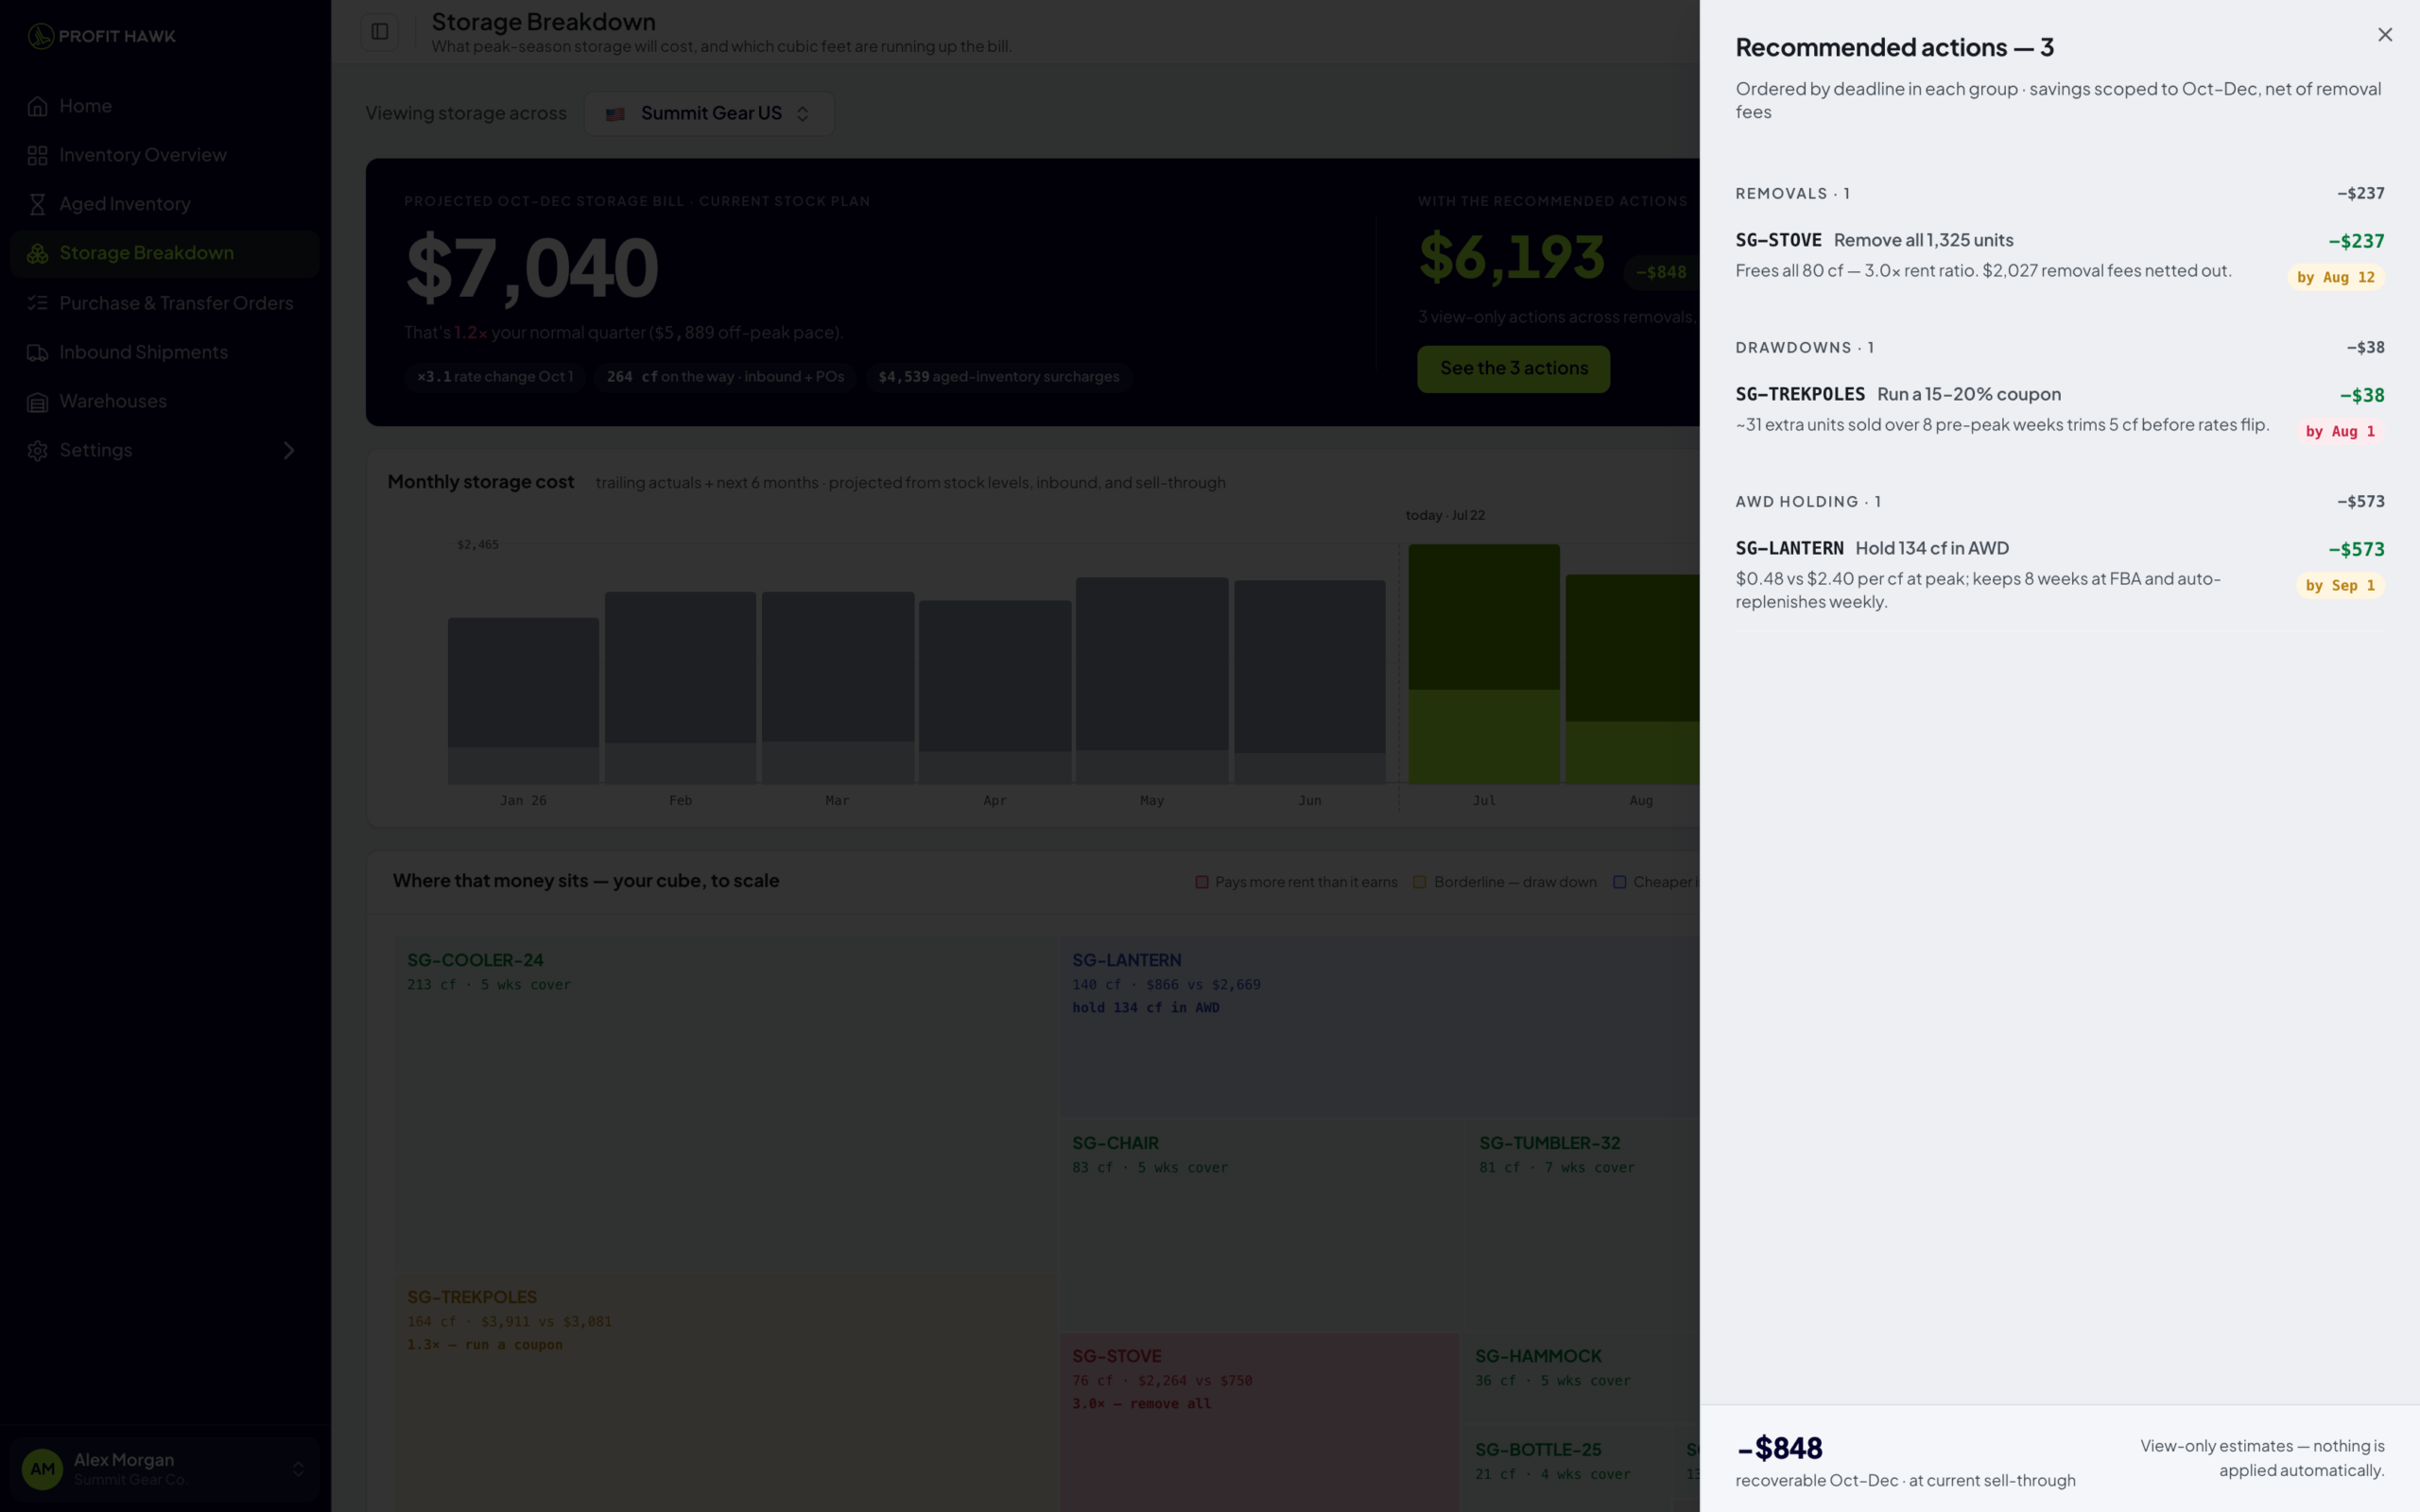
Click See the actions in the top panel to open the recommendations. Profit Hawk computes at most one action per SKU, grouped by type and ordered by deadline:
- Removals: Stock that costs more to store through peak than it earns, where a removal order saves money even after Amazon's removal fees. SKUs already paying the aged-inventory surcharge get a deadline a few days before Amazon's monthly age snapshot on the 15th, so the removal order is in before the next charge.
- Drawdowns: Borderline SKUs where a 15 to 20 percent coupon over the pre-peak weeks trims enough cube to pay for itself before rates flip.
- AWD holding: Healthy but heavily overstocked US standard-size SKUs where the excess cover is cheaper to hold in AWD and auto-replenish to FBA weekly.
All three run on the same seasonal sell-through as the projection, so stock that your peak season is expected to sell is not flagged for removal at its off-season pace.
Each action shows its estimated savings over the peak window and a do-by date. The list is view-only: nothing is applied automatically, and you execute any action you choose in Seller Central.
On US channels, removal savings are net of Amazon's removal fees, and each removal row shows the fees that were netted out. On other marketplaces Profit Hawk does not estimate local removal fees, so savings are shown before removal fees and the row says so.
Peak storage rates (US channels)
US channels also get a reference card with Amazon's current monthly storage rates:
| Rate per cubic foot | Jan-Sep | Oct-Dec |
|---|---|---|
| Standard size | $0.78 | $2.40 |
| Oversize | $0.56 | $1.40 |
| AWD | $0.48 | $0.48 |
AWD stays flat year round, which is why moving excess cover there ahead of peak is often the cheapest option for slow, healthy stock.
How the fees are estimated
Profit Hawk is deliberately conservative about inventing numbers:
- US channels are projected on Amazon's published rate card, calibrated against Amazon's own estimated storage cost for next month from your inventory reports. That calibration folds in things like the storage utilization surcharge without modeling them separately.
- Other marketplaces are projected from the storage rate implied by Amazon's own estimate for your stock, held flat across the year. Profit Hawk never invents local rate cards, so non-US projections do not include an October rate jump unless Amazon's own figures show one.
- Sell-through is seasonal. Projected sales follow each product's demand forecast for the near term, then the seasonality of its primary keyword, the same pattern behind the forecast chart. A product that sells mostly in the fourth quarter is credited those peak sales when the projection prices October through December, instead of being priced at a flat off-season pace. Seasonality changes when units are projected to sell, never how many sell across a year; products without a primary keyword keep the flat trailing 30-day pace.
- Profit and rent ratios require the full margin picture: price, referral fee, fulfillment fee, and your unit cost. If any component is missing, the SKU shows no ratio rather than a misleading one. Add missing costs under Product Costs.
Choosing a sales channel
The selector at the top picks the channel you are analyzing, one at a time, in that channel's currency. If you run Pan-EU, your euro-billing European marketplaces appear as a single pooled option. Marketplaces that bill in other currencies (such as Sweden or Poland) stay as their own options so the totals never mix currencies.
Related pages
Aged Inventory Analyzer
The aged-inventory surcharge that feeds this page's projections, in full detail.
Product Costs
Add unit costs so profit and rent ratios are complete.
Inbound Shipments
The FBA inbound shipments that appear in the Inbound & POs card.
Creating Purchase Orders
The active orders whose arrivals feed the projection.
How Forecasting Works
The demand forecast and keyword seasonality behind the projected sell-through.